LinkedIn campaign monitoring that scales
LinkedIn campaign monitoring that scales
You know the pattern: campaigns look fine, but invites pile up, acceptance rates dip, and replies get quieter each week. It’s never a crash, just a slow fade… until you get that “Hey, what’s going on with my campaigns?” message.
The fix? Build a real-time campaign management and outbound delivery health system that catches issues early and keeps every account steady.
With HeyReach Dashboard Exports and Master View, you can handle monitor campaign tracking and monitor sender health like a live pulse + spot trends the moment they shift (aka Baselines → Monitoring → Alerts → Scorecard → Recovery).
Let me show you how to build a five-part system that keeps you in control long before clients notice something’s off.
4 LinkedIn campaign performance metrics that predict client issues (before complaints come)
Most client problems start quietly – with a small dip here, a delay there.
If you track these four metrics inside HeyReach, you’ll catch the warning signs on time
1. Connection acceptance rate
Target: 25–30% (depends on niche & ICP quality)
What it predicts: A falling acceptance rate usually means targeting or sender credibility is slipping. LinkedIn starts showing your invites to fewer people, and campaigns lose traction fast.
Where to find: In HeyReach Dashboard → Campaign Overview (Master view). You can also schedule exports weekly using n8n’s official HeyReach node to track trends automatically.
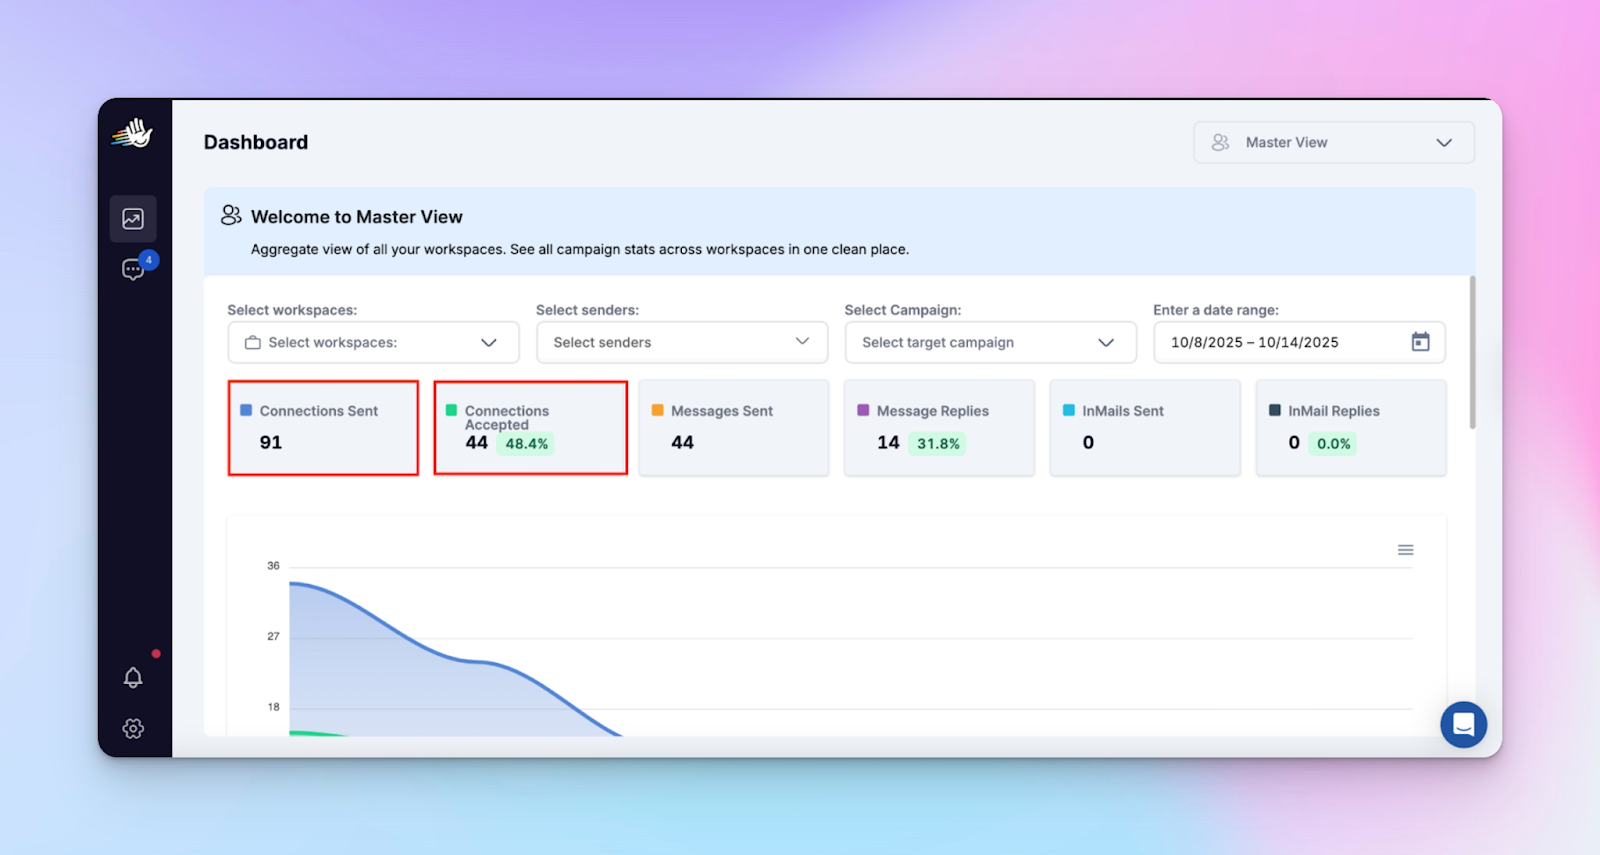
Red flag: Below 25% for more than one week = your sender might be hitting fatigue. Time to refresh targeting or pause sequences.
2. Reply rate
Target: 20-40% (anything below 20 isn’t good)
What it predicts: Reply rate is your early pulse check for engagement. When it drops, personalization is off or LinkedIn is throttling delivery.
Where to find: In HeyReach Dashboard (Master view)→ metric “Message replies,” or under Performance Analytics → Campaign metrics.
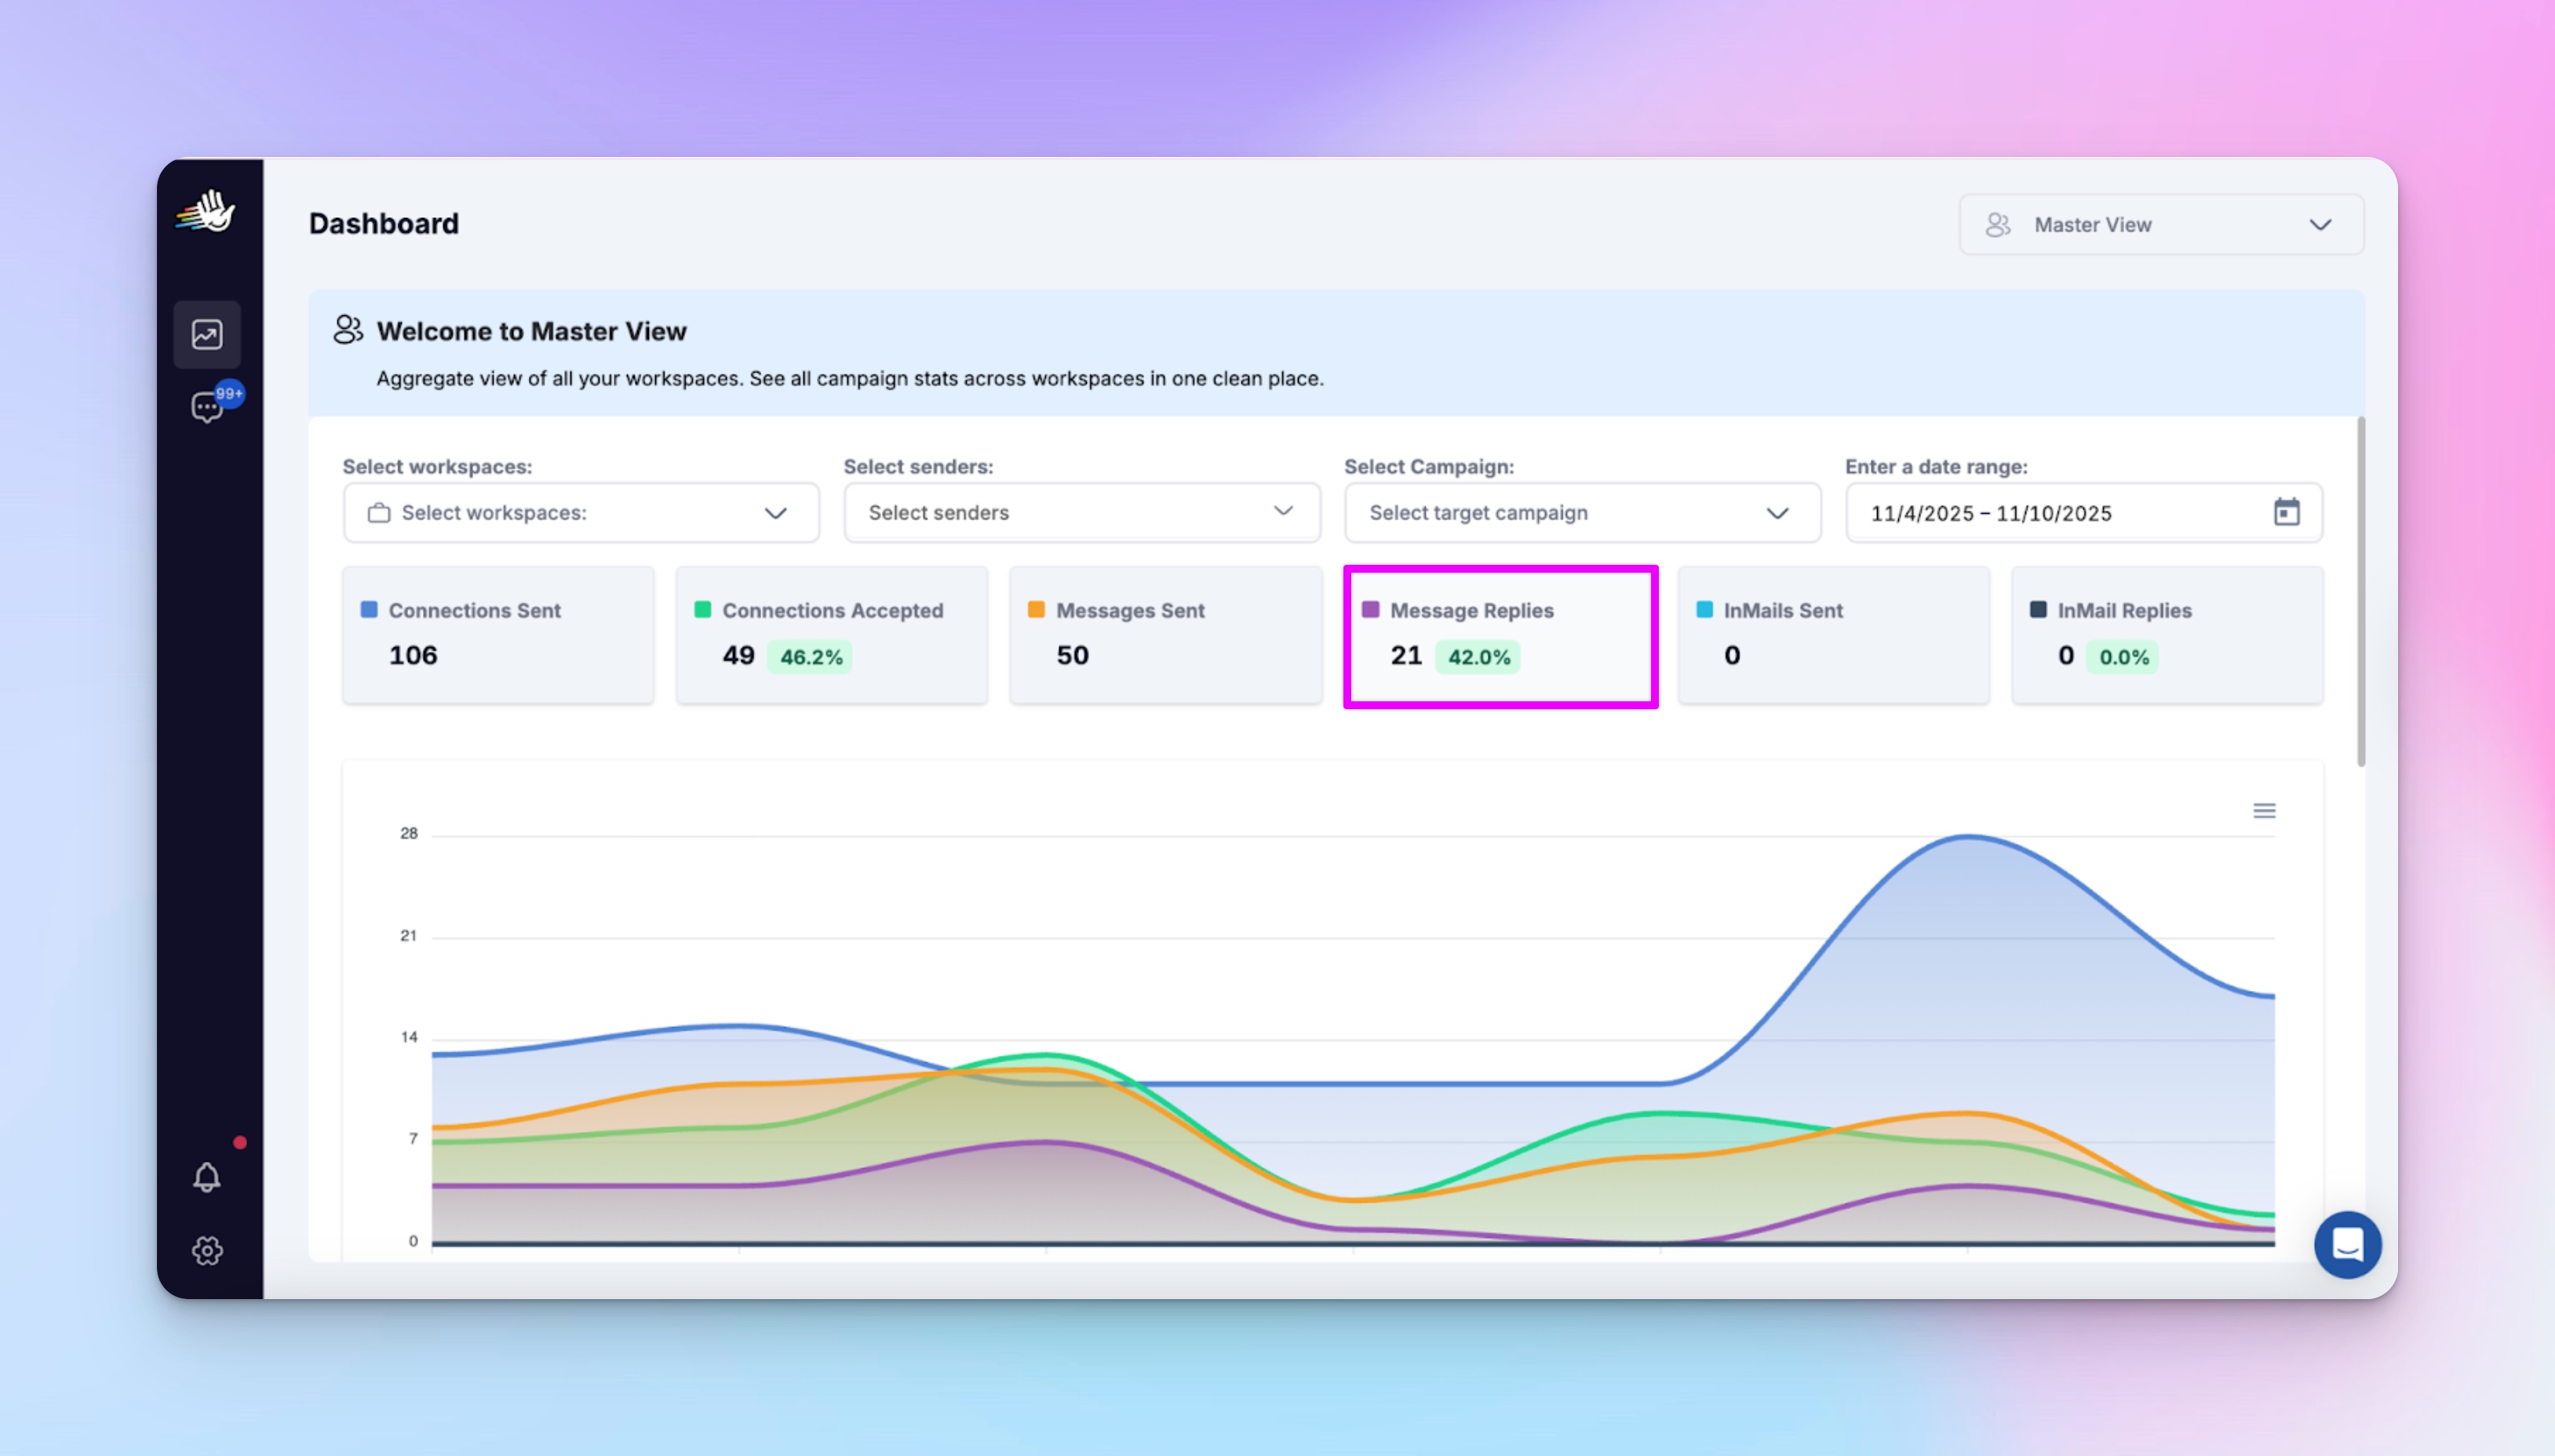
Red flag: A 5–10% dip week-to-week means fewer conversations and colder outreach. Check message copy or reply timing.
Pro tip: It’s also a good idea to monitor click-through rates on message links or CTAs as a secondary engagement signal. If replies are steady but CTR falls, it’s time to review your offer or follow-up timing.
And for teams running LinkedIn and email outreach together, pair reply rates with open rates to get the full picture of engagement quality.
3. Pending requests
Target: Keep under 50 pending invites per sender
What it predicts: When pending requests pile up, LinkedIn quietly limits visibility (even your best-performing campaigns will slow down).
Where to find: Check HeyReach → Campaigns → Viewing Campaign Details.
Each campaign shows progress: leads that are pending, in sequence, finished, or failed
You can also view up to 10 campaigns per page and navigate through results for a full snapshot of sender activity.
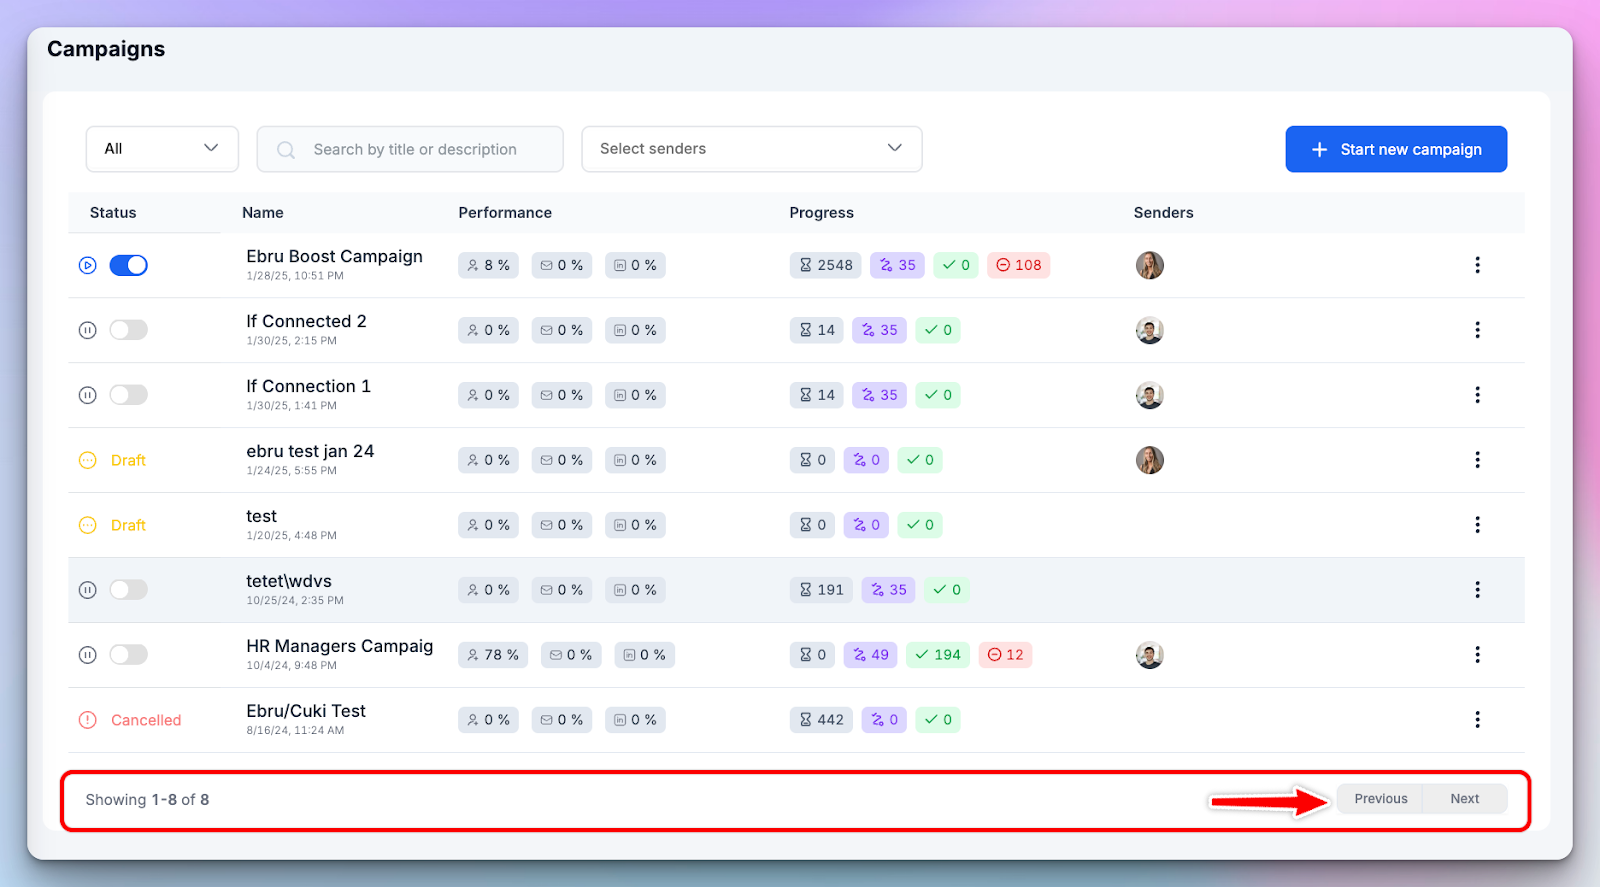
Red flag:Crossing 50 = clean-up time. Use HeyReach’s auto-withdrawal setting to clear old invites safely without manual work.
4. Daily send volume
Target: Consistent, gradual activity (no big spikes)
What it predicts: Irregular sending patterns trigger LinkedIn’s anti-spam detection, increase bounce rates, and lower deliverability.
Where to find: You can see total actions per sender in Dashboard Exports and compare them against daily limits under LinkedIn Accounts → Configure Limits.
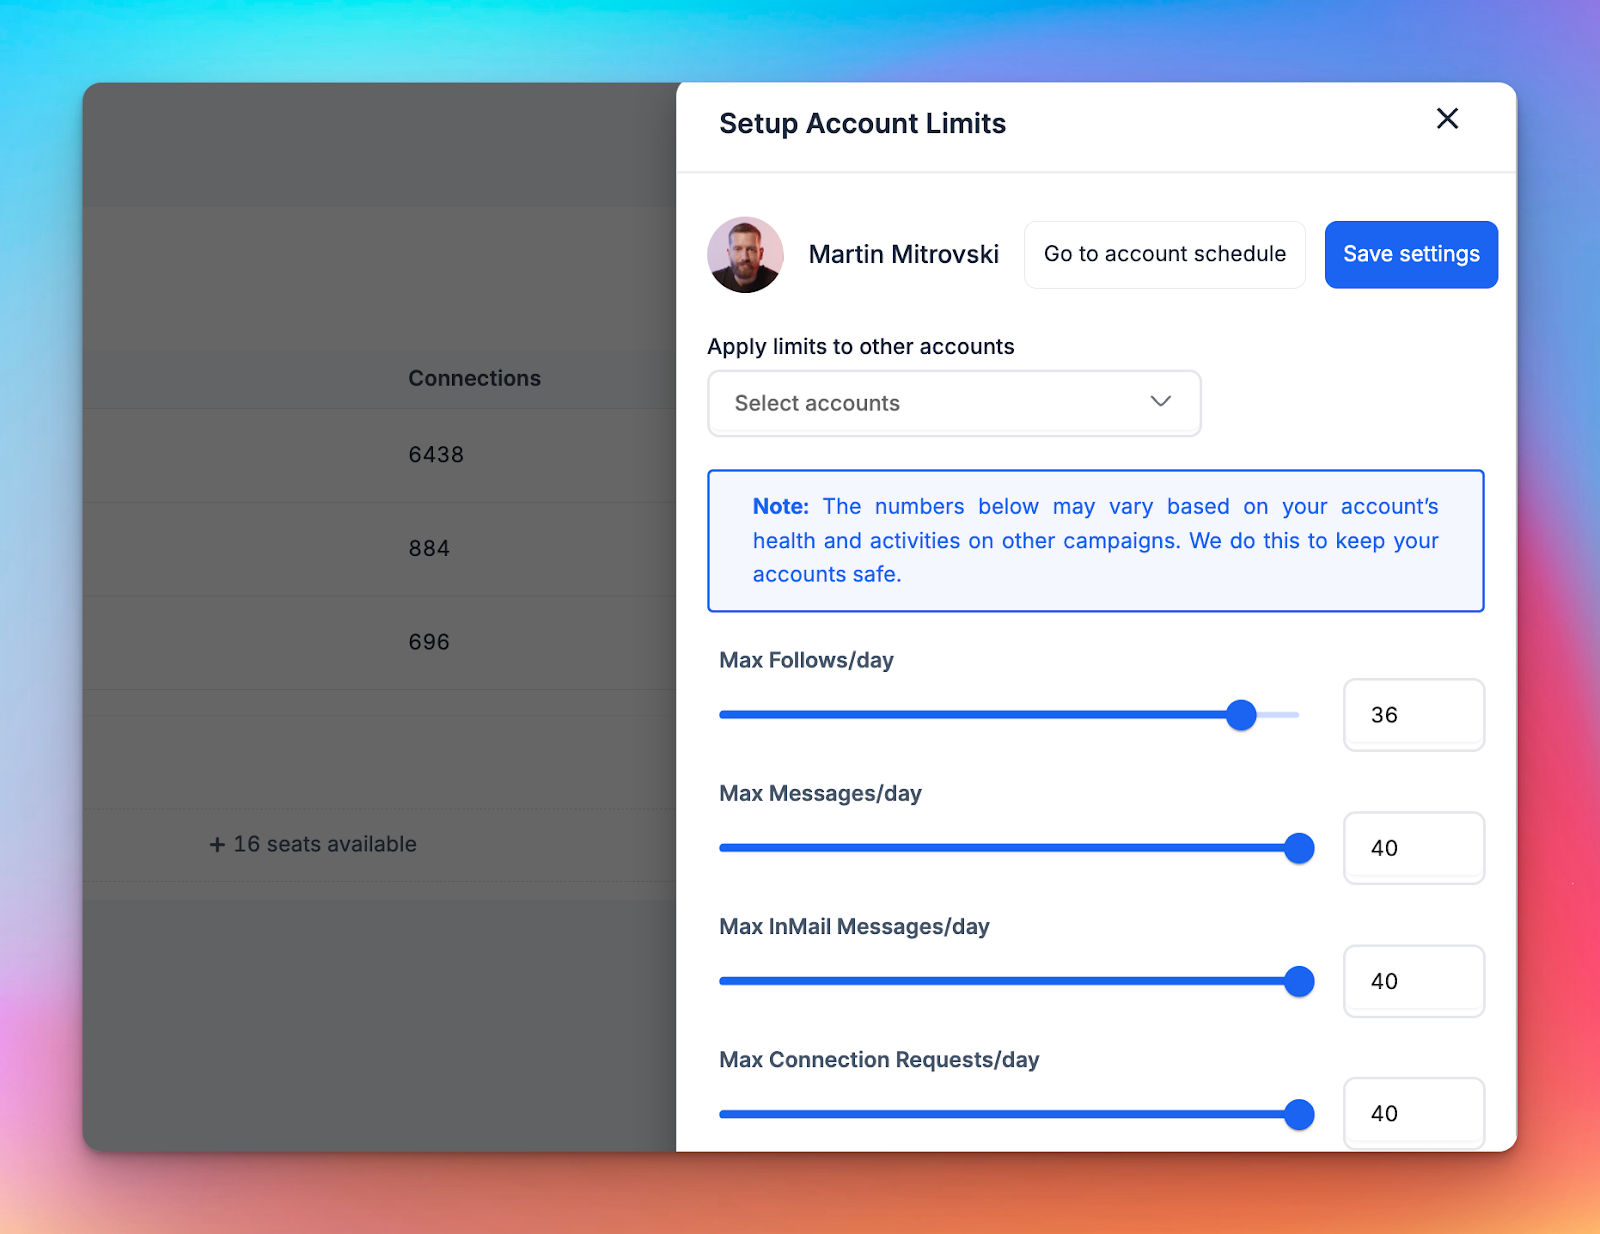
Red flag: Sharp daily swings (like 40 → 100 → 30) = pacing issue. Check your campaign scheduler or seat rotation limits.
Build your campaign monitoring baseline so “bad” is measurable
You can’t fix what you can’t measure. If every client’s “bad week” means something different, ops turns reactive instead of reliable. That’s why you need shared thresholds – simple, defensible, and consistent – the foundation of every effective campaign.
Define clear key performance indicators that show exactly when campaign health moves from normal to risky.
Let’s do it.
1. Set shared thresholds per client tier
Start by defining performance tiers (e.g., Enterprise, SMB, Startup) and assign baseline metrics for each.
This way, when a sender’s numbers dip, you instantly know whether it’s a small fluctuation or a red flag.
Use HeyReach Dashboard Exports or Master View to pull the last 4–8 weeks of real-time data per sender.
Then calculate:
- Median (safe zone) → your true baseline
- −10% (watch zone) → early warning
- −20% (action zone) → needs investigation
Example: If your average connection acceptance rate is 40%, then:
- Safe: 40%
- Watch: 36%
- Action: 32%
No fancy math – just week-by-week exports and one Google Sheet formula.
2. Back it up with credible benchmarks
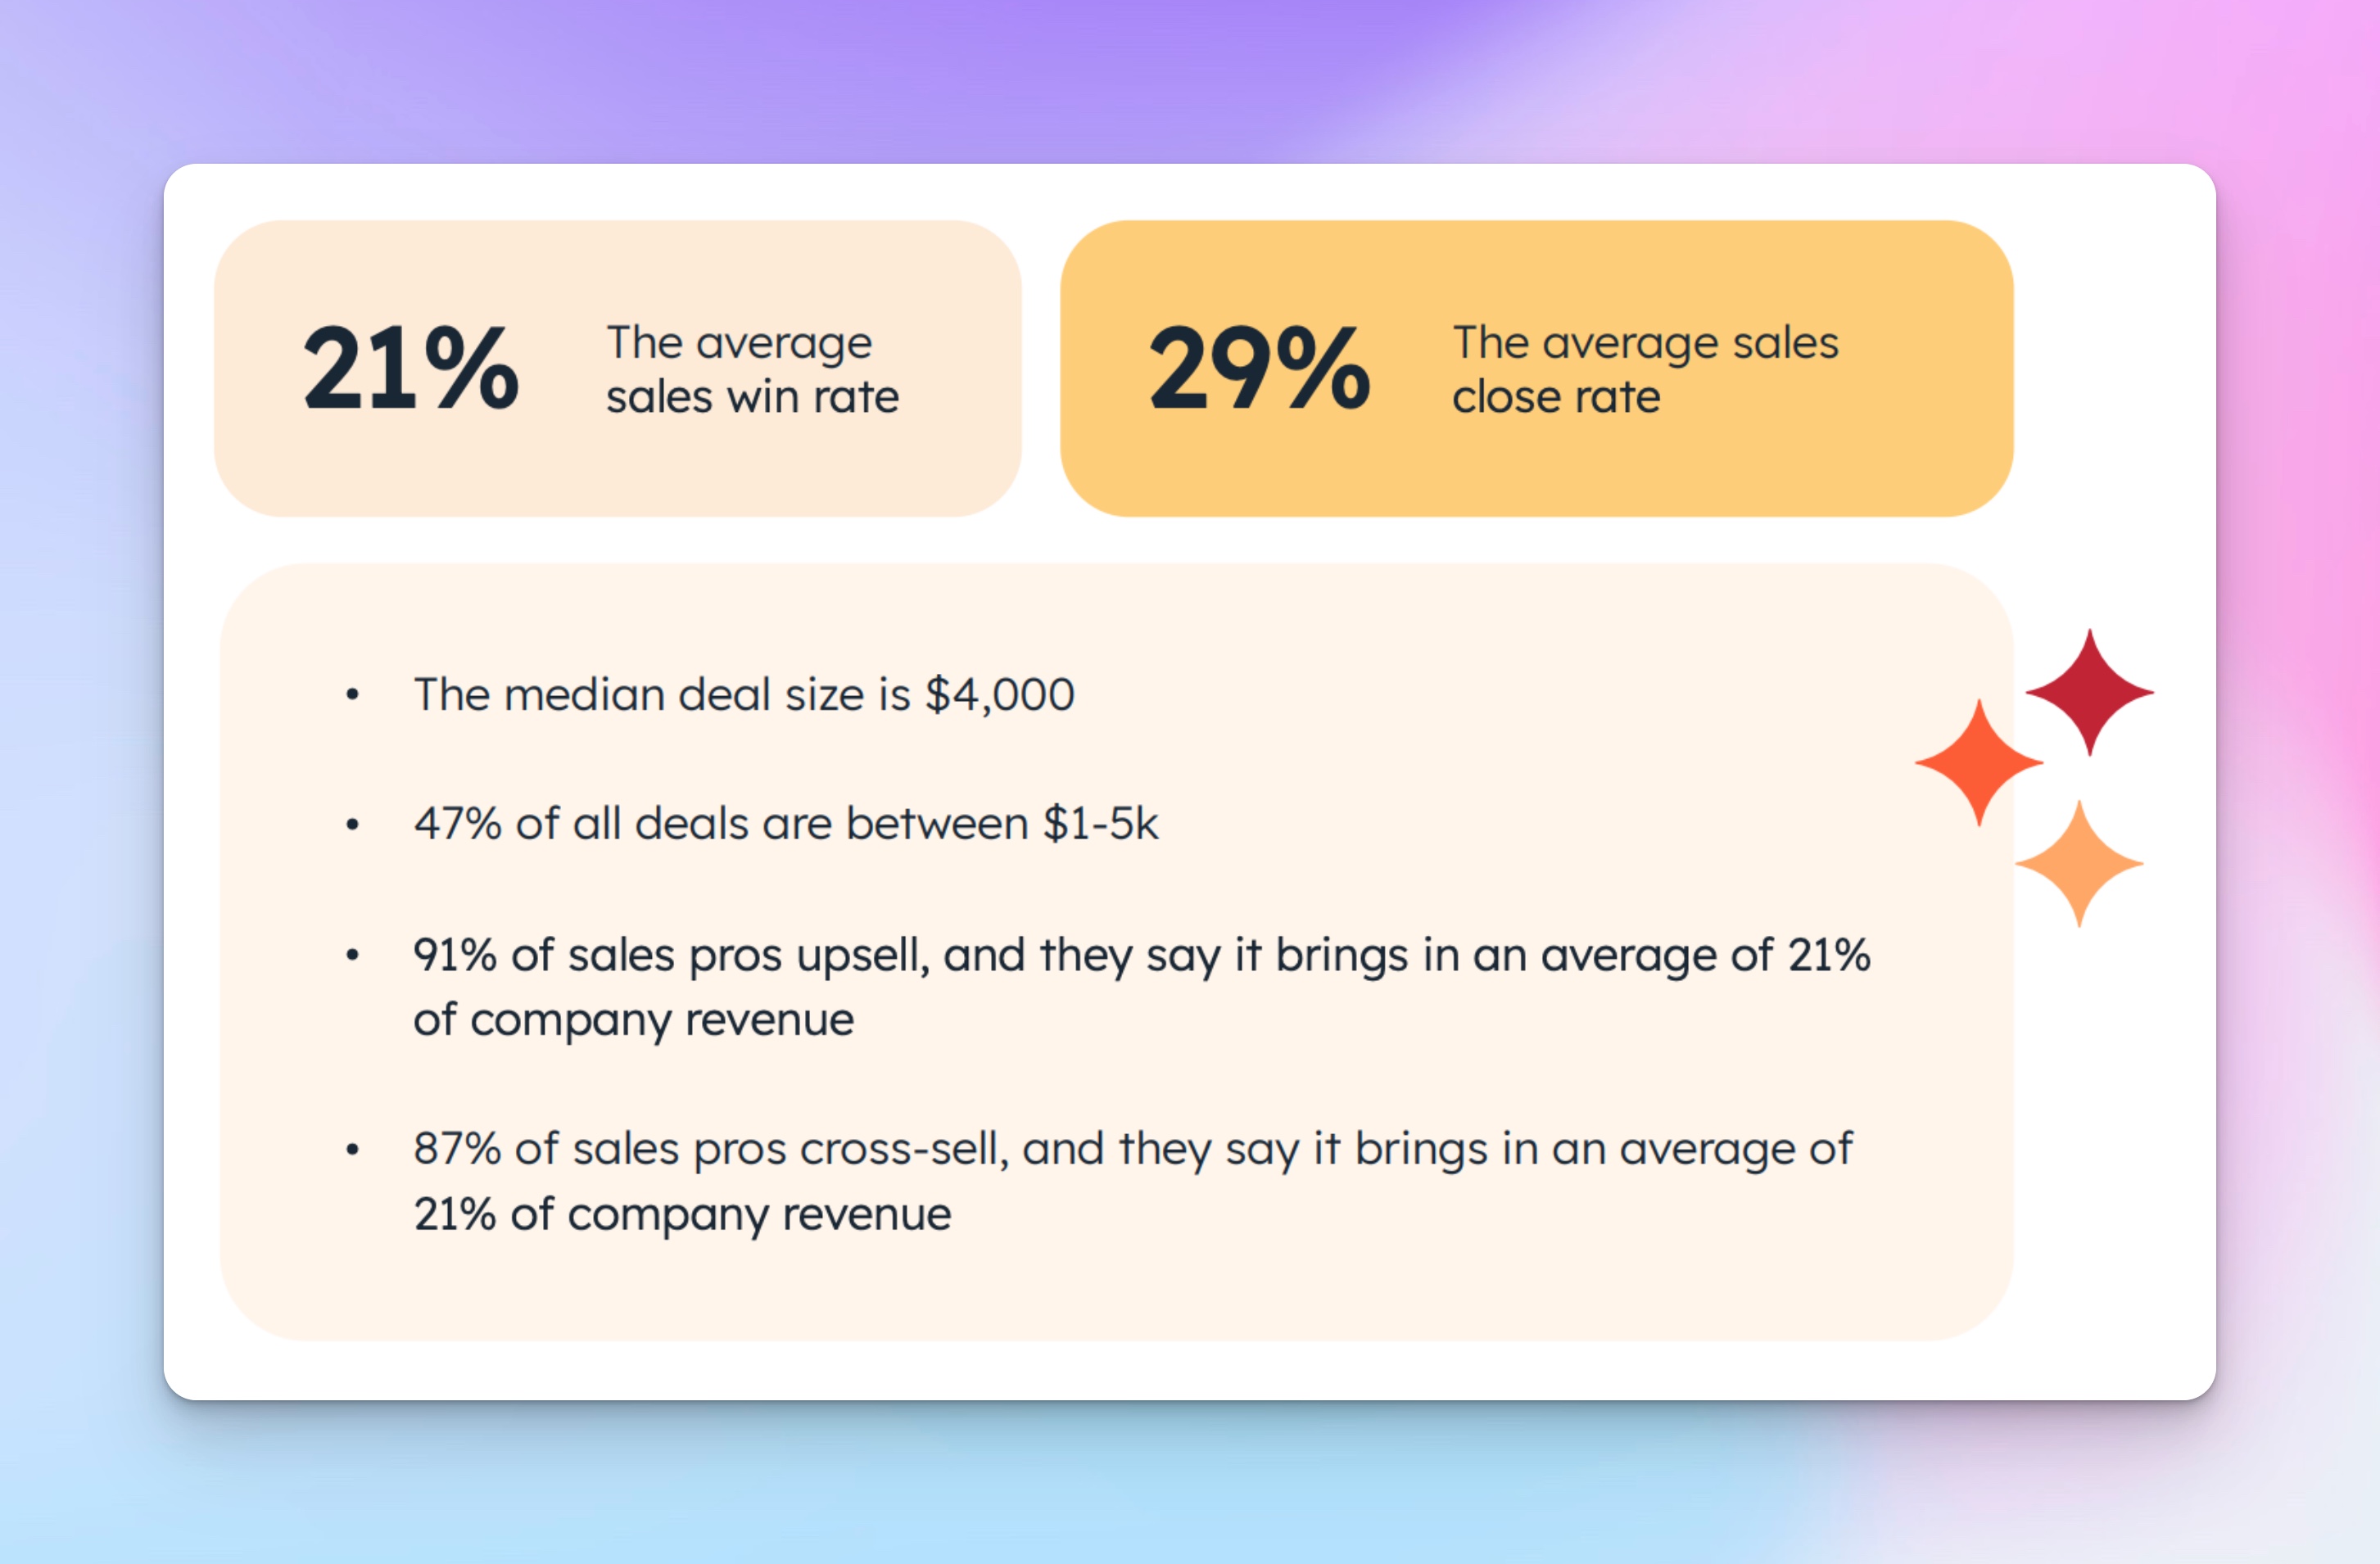
Use these 4 benchmarks to sanity-check your campaign goals and spot what needs a quick tweak:
- Connection acceptance rate: ~26% (with or without a message)
- Reply rate: 6–9%, higher with personalized or AI-assisted messages
- Top-performing campaign type: Messenger campaigns (≈11.7% reply rate)
- Average conversion rate: Typically between 2–5% depending on campaign goal and CTA strength.
Pro tip: Pull valuable insights from the HubSpot 2024 Sales Trends Report – it covers both email marketing and outreach benchmarks, helping you align performance across all your channels.
3. Customize by ICP and campaign type
Baselines differ by target audience and intent:
- Outbound to warm leads = higher reply threshold
- Cold ICP expansion = lower acceptance baseline
- Nurture sequences = longer engagement cycles
If your agency runs multiple verticals, let each team adjust the “safe/watch/action” thresholds based on ICP maturity, product type, and sender seat history.
TL;DR: Download your HeyReach exports → find medians → apply −10% / −20% bands. Now, “bad” becomes measurable, and ops can prioritize action before clients notice a trend.
Automate campaign tracking and monitoring in 15 minutes
You don’t need another performance dashboard. You just need a system with the right functionalities that makes trend drift impossible to miss.
In 15 minutes, you can automate and streamline weekly campaign monitoring across all clients.
Here’s how
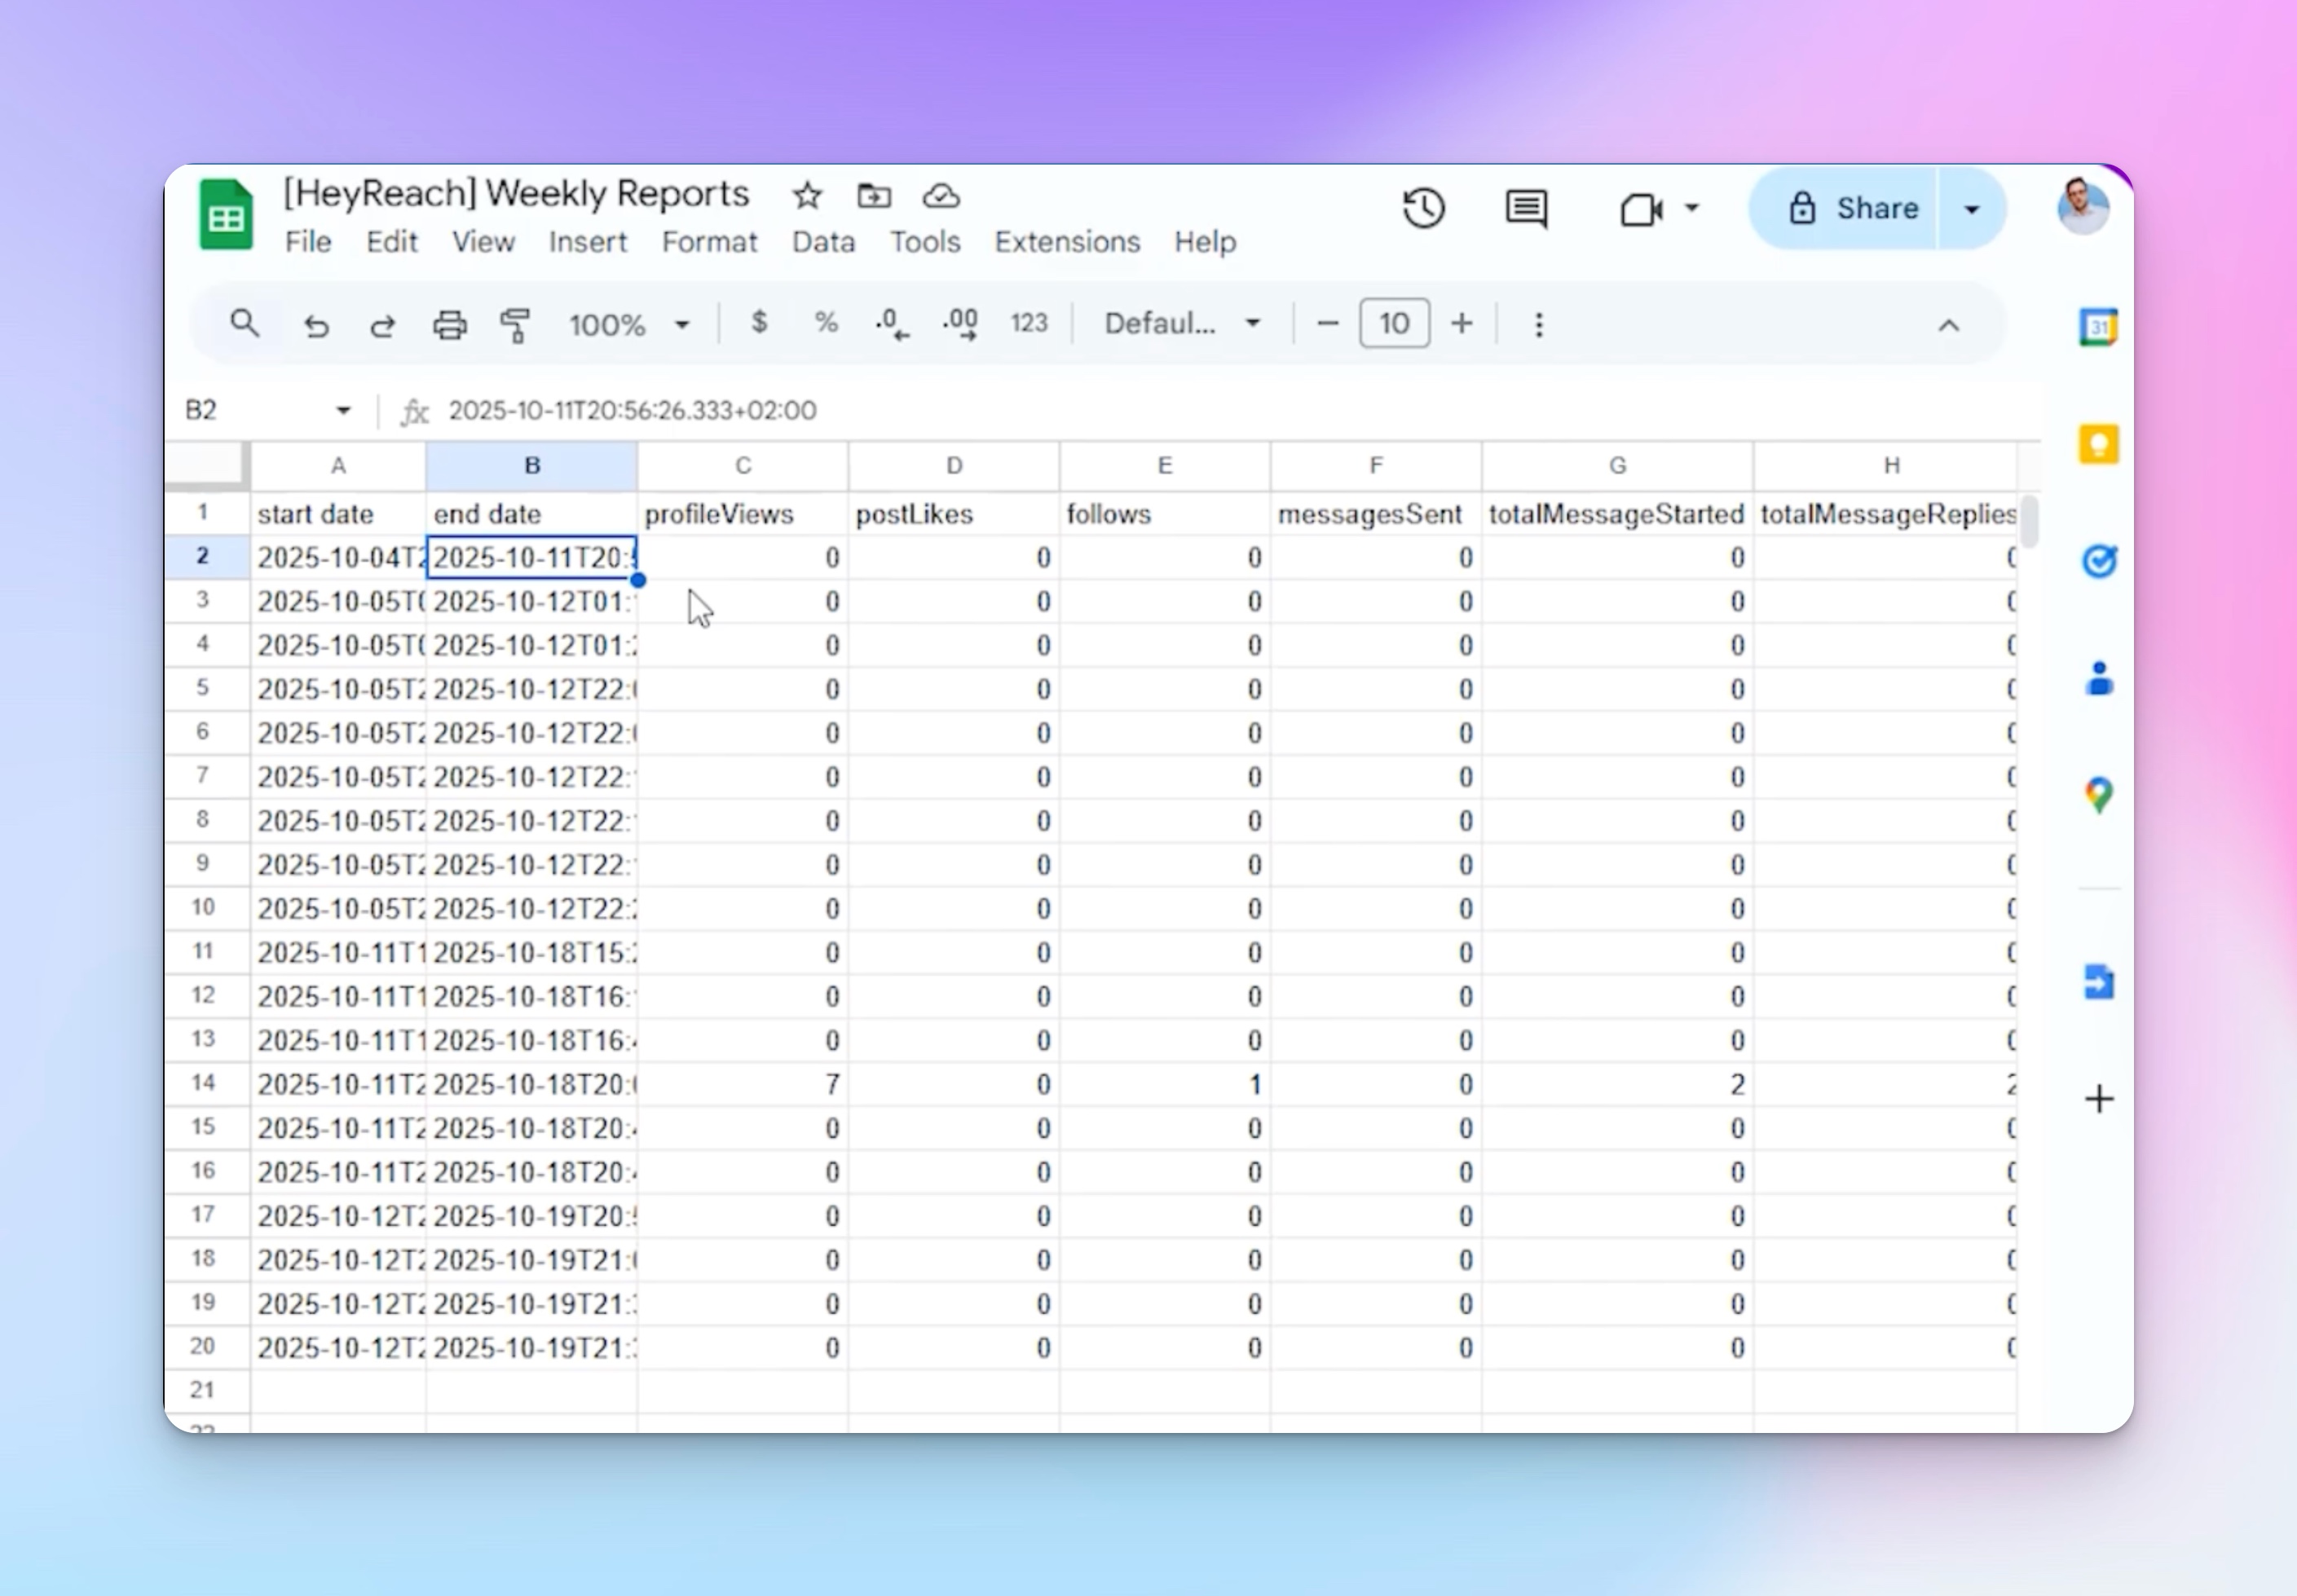
- Export: From your HeyReach Dashboard Export, pull campaign data (connection acceptance, reply rate, pending invites, total sends).
- Append to Google Sheets: Each week, add new export data to a shared Sheet – one tab per week or one long list with a date column.
- Pivot by Client / Seat / Week: Use a simple pivot table to summarize acceptance and reply rates for every sender seat.
- Add trend visuals: Insert sparklines next to each metric to see week-over-week drift.
- Flag issues automatically:
Apply conditional formatting:- Safe zone → normal color
- Watch zone (−10%) → yellow
- Action zone (−20%) → red
- Automate updates: Using n8n’s official HeyReach integration, you can run this flow automatically.
For example:- A scheduled trigger (set to Monday 00:00)
- A HeyReach node to pull campaign data (total + weekly stats)
- A Google Sheets node to append rows
Now, every sender’s performance becomes instantly visible. The moment numbers start slipping, you’ll see it.
👀 Why Google Sheets?
Because it matches how agencies work. It’s fast, collaborative, and shareable.
Anyone on your ops team (or client side) can filter, comment, or build quick visual dashboards.
You can even automate this via n8n + HeyReach API so new rows are added weekly while you sleep.
For agencies managing multiple workspaces
If you’re running dozens of client accounts, start in Master View for a daily cross-workspace overview.
It shows which workspaces are trending down, so you can prioritize exports and deep dives only for those clients instead of pulling every account weekly.
Once you’ve built your internal system…
You’ll probably want to automate client-facing reports too. Watch our step-by-step video tutorial because it shows how to:
- Pull weekly campaign stats automatically
- Save them to Google Sheets
- Draft an email with results ready to send to clients every Monday morning
TL;DR: Export from HeyReach → append to Sheets → pivot by Client/Seat/Week → add sparklines and alerts.
In 10-15 minutes, you’ll have a live campaign performance monitor that never sleeps and never misses a dip.
Get performance-drop alerts before client calls
Don’t wait until your client picks up the phone angry. Automate notifications so you know first. When key metrics slip past your “watch” or “action” threshold, trigger Slack pings and CRM tasks automatically.
How to build the alert system
1. Connect your data source
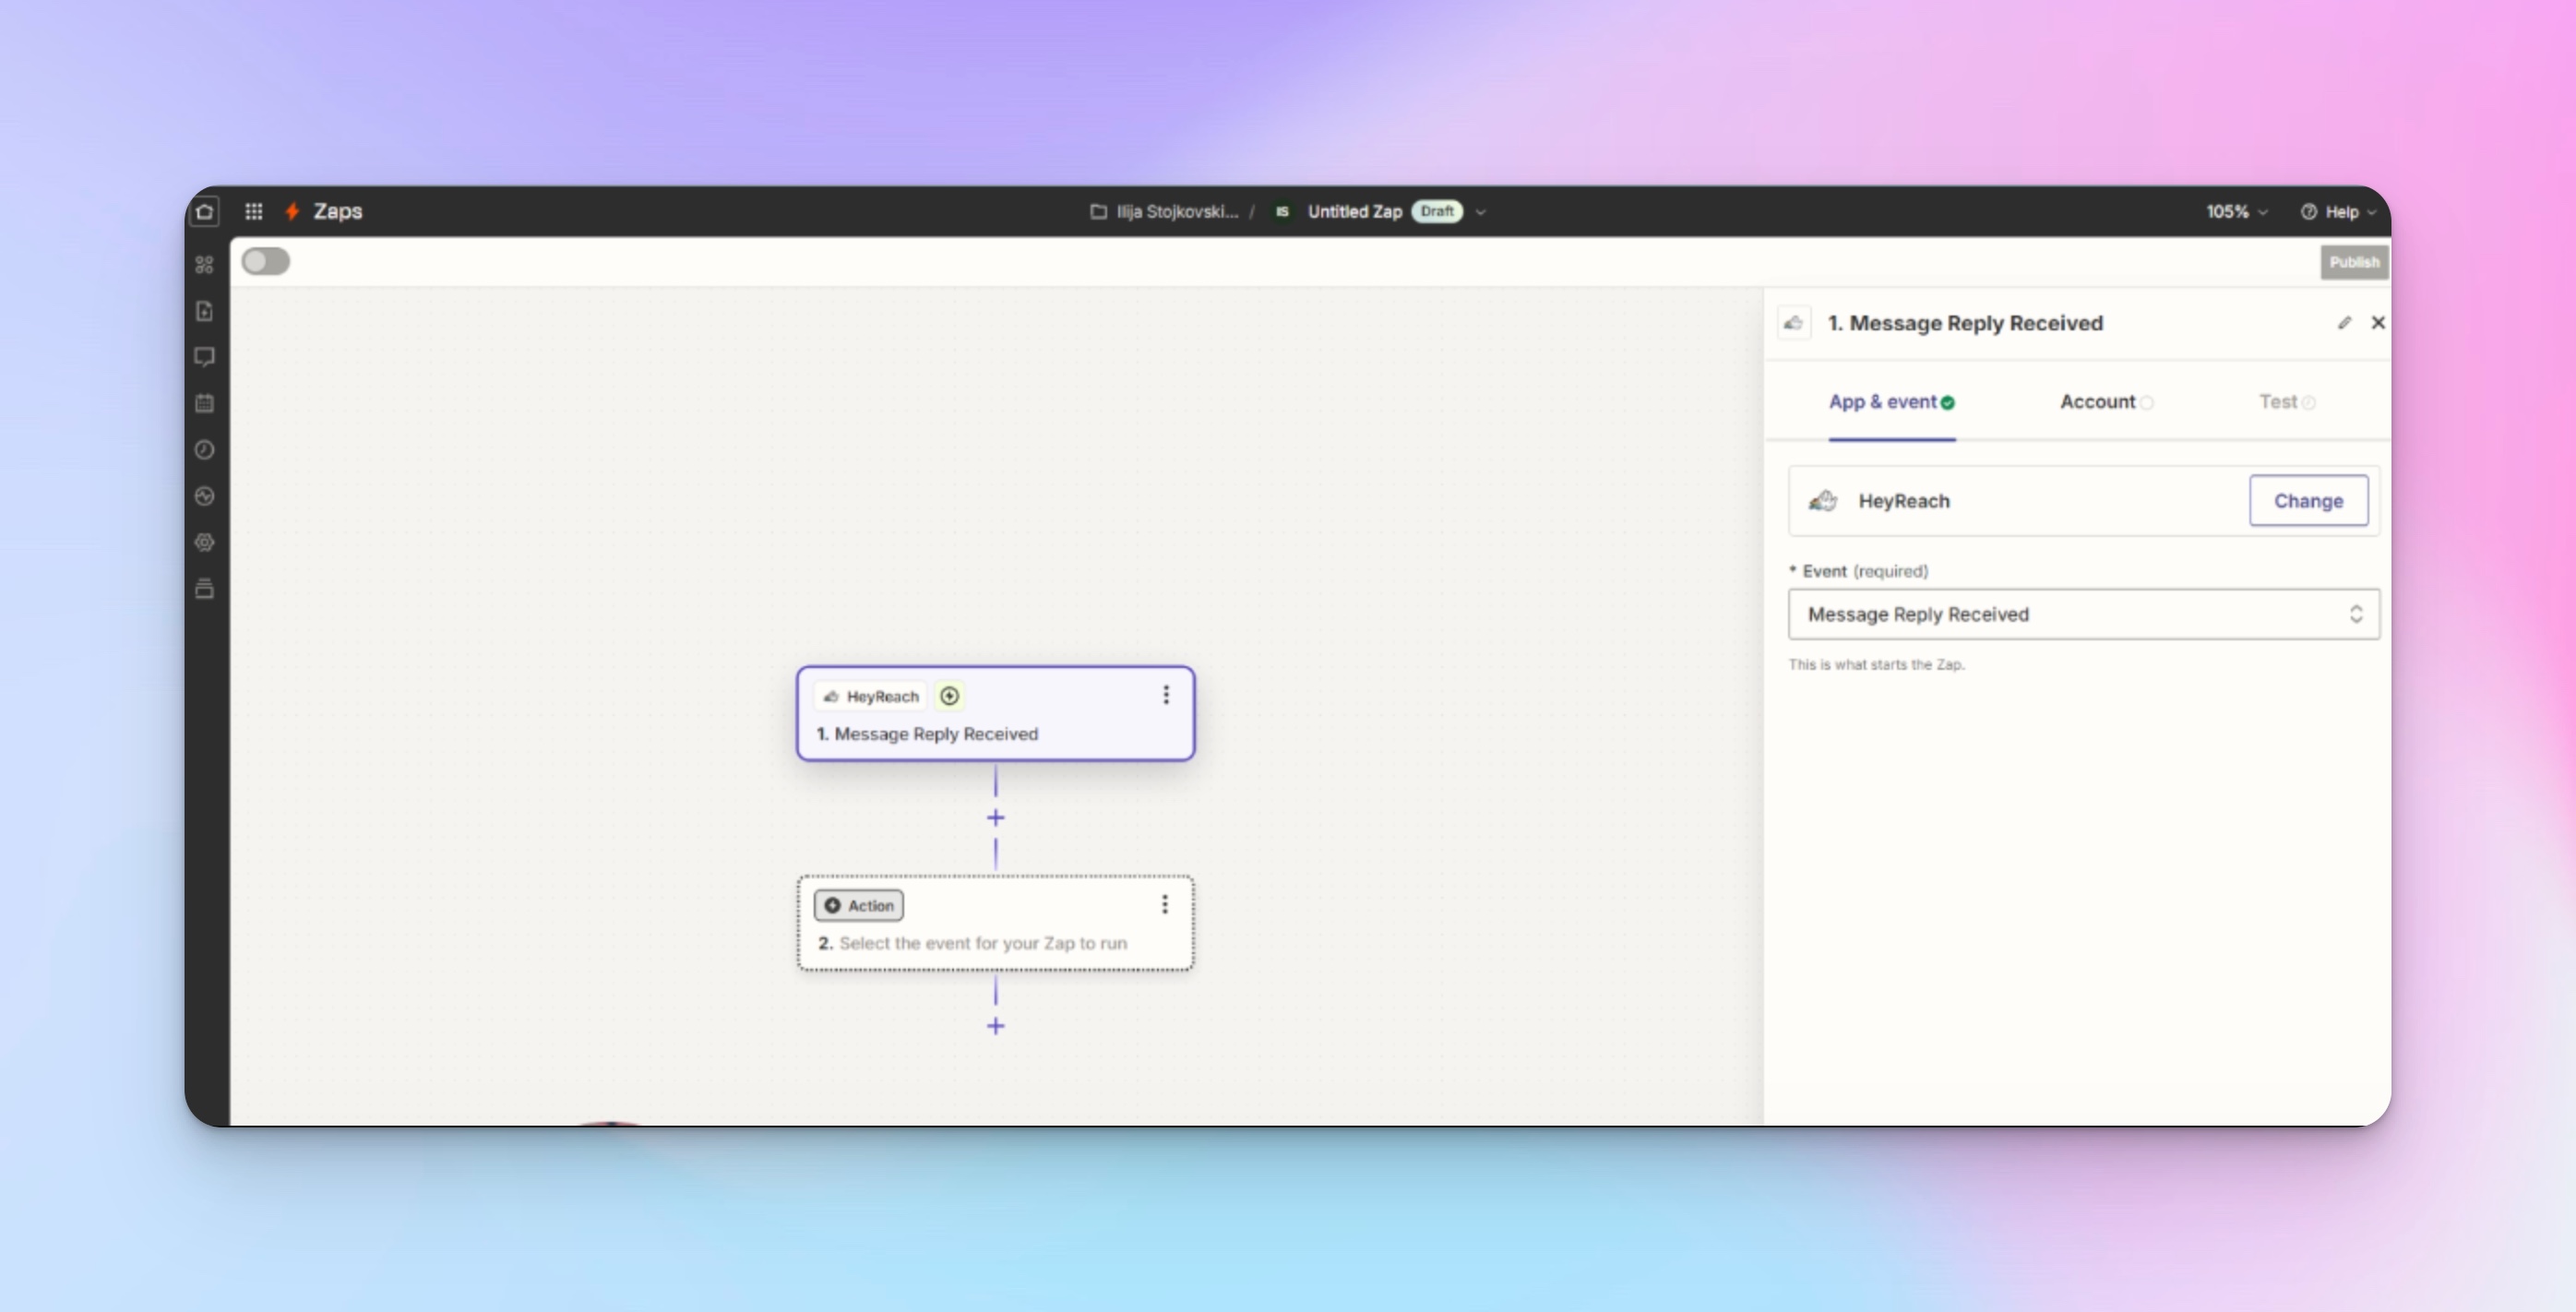
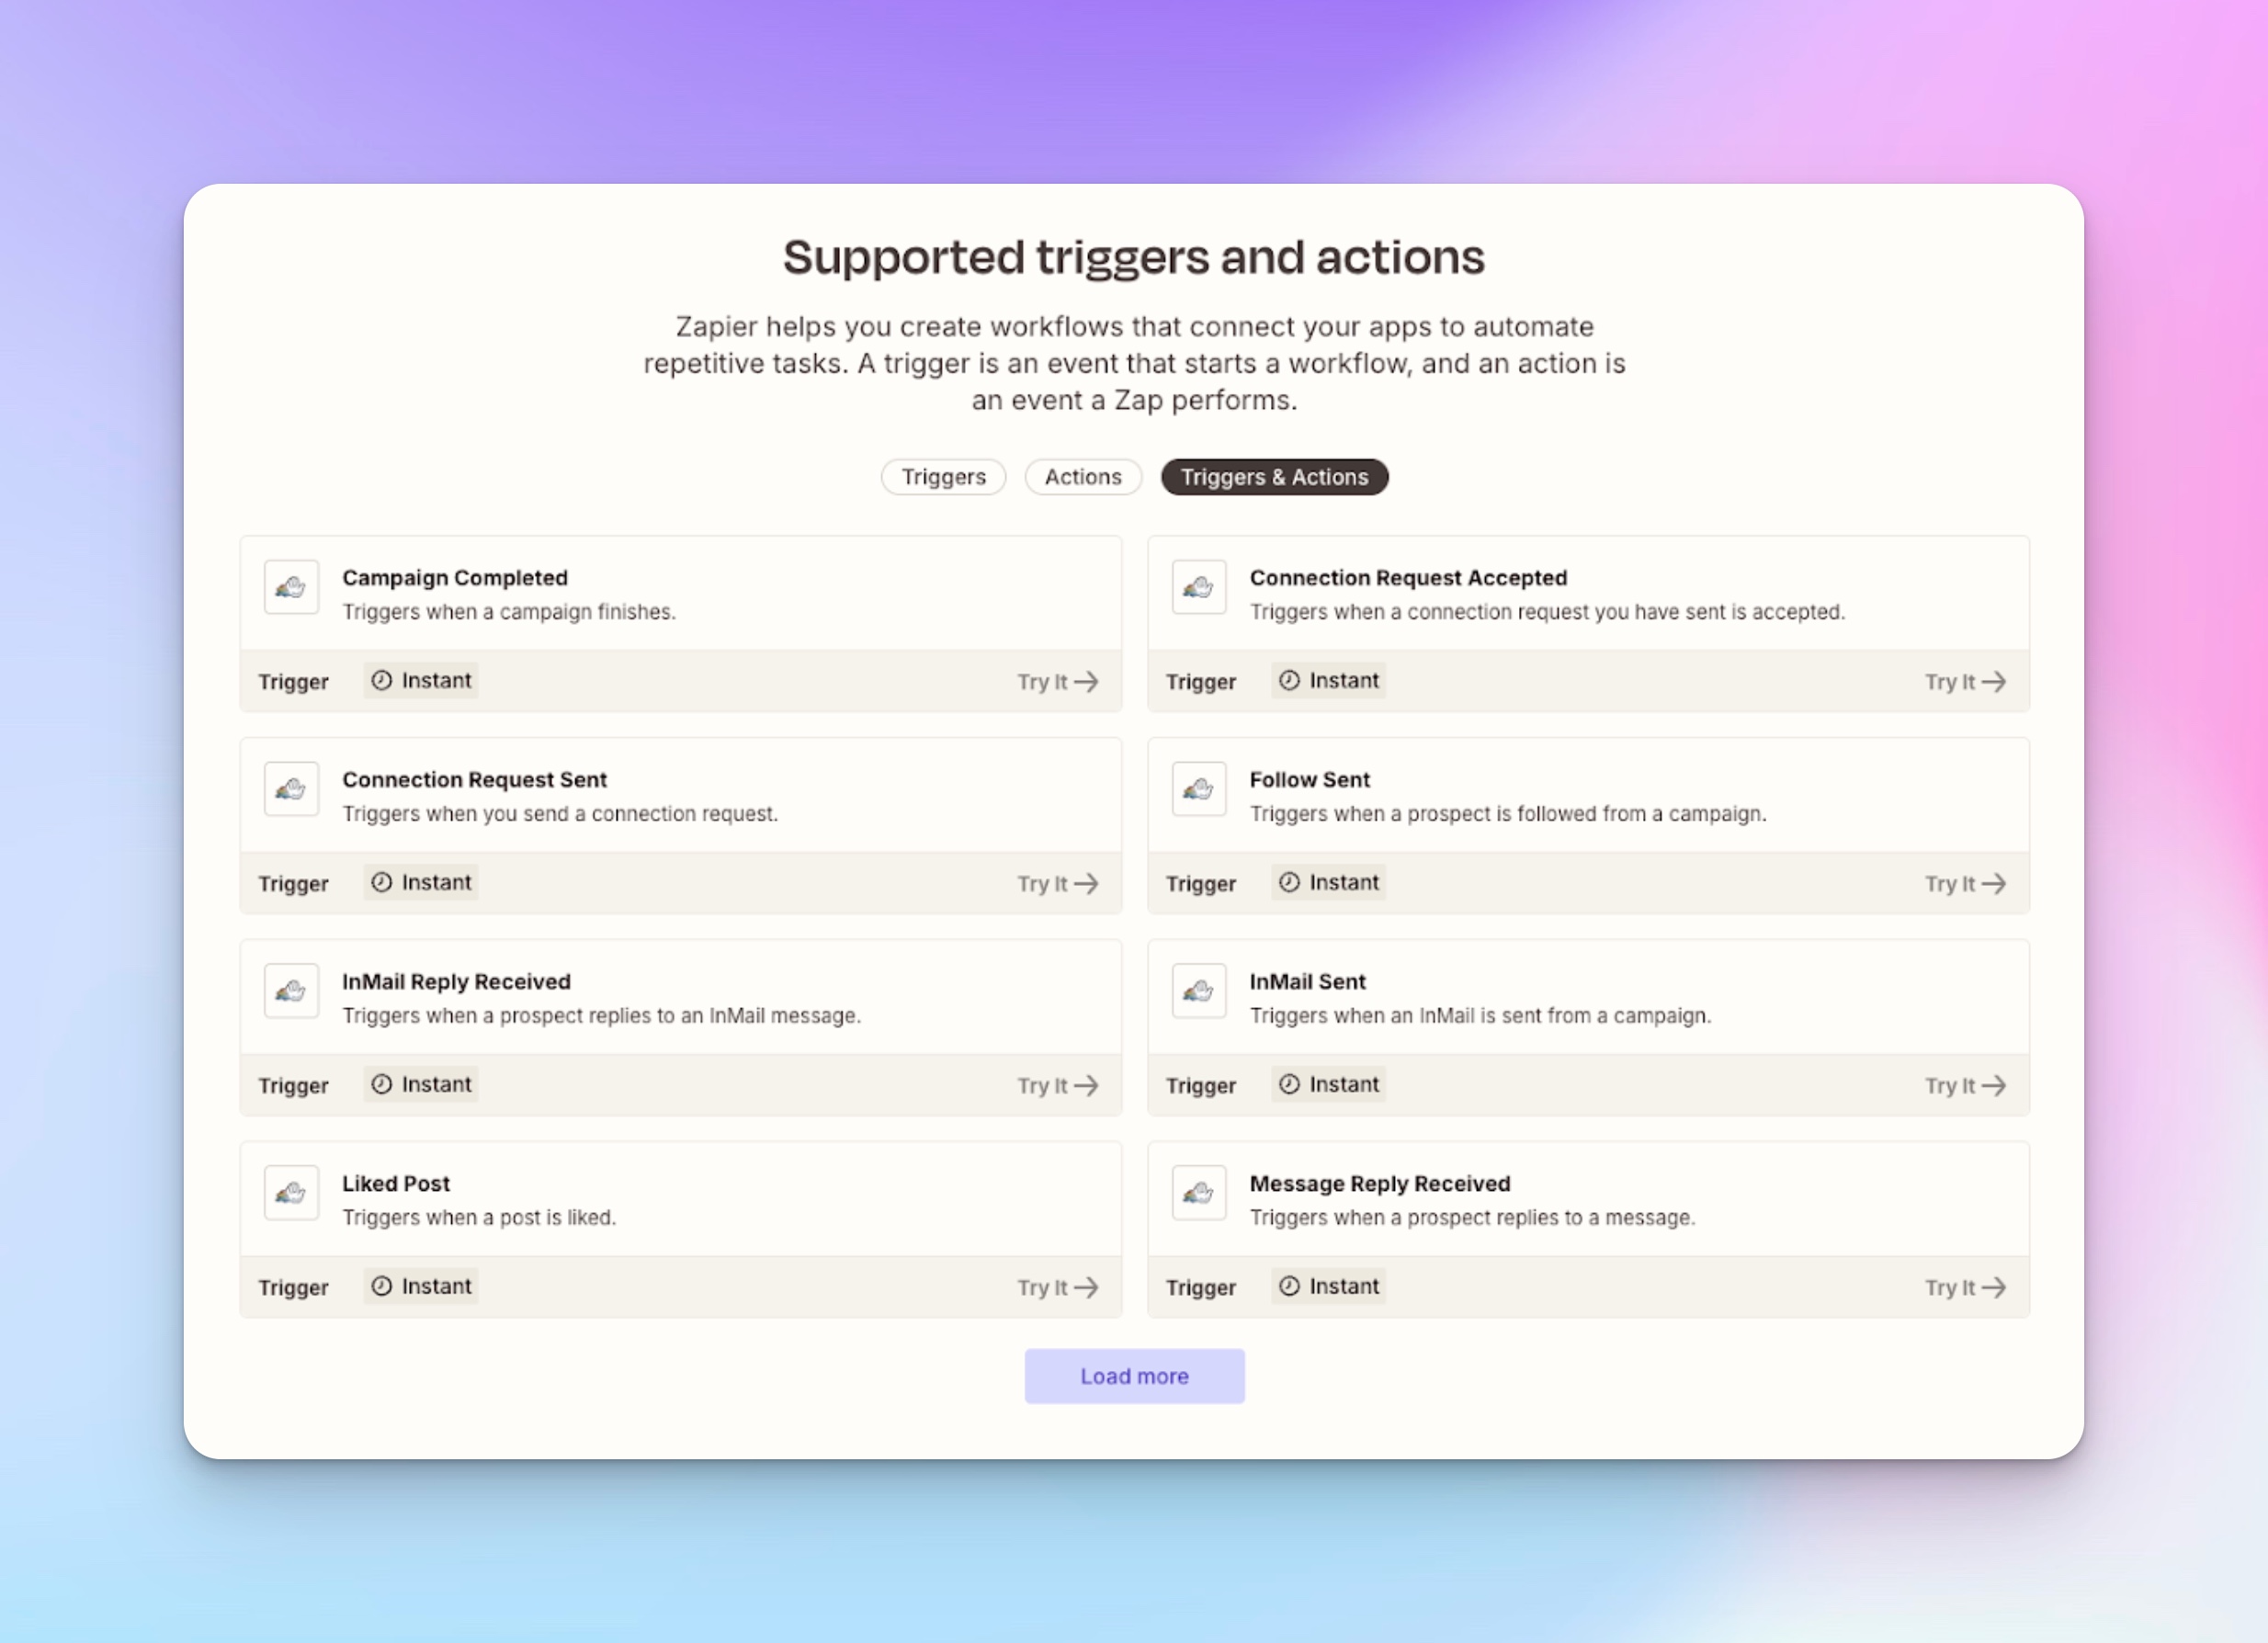
Your weekly metrics live in Google Sheets (acceptance rate, reply rate, etc.). Use the official HeyReach + Zapier integration – it supports triggers like “Connection Request Sent”, “InMail Reply Received”, or “Campaign Completed”.
You can also use webhooks via HeyReach’s API if you’re using n8n or Make.
2. Create alert logic
Embed rules inside your spreadsheet or in Zapier:
- Trigger when acceptance rate < Watch threshold
- Trigger when reply rate drops > 20% week-over-week
- Example: if a seat’s reply rate was 12% last week and this week it’s 9%, you’ve hit a ~25% drop => alert.
- Then action #1: Send a Slack DM to the seat’s owner
- Action #2: Create a task in HubSpot with a due date (e.g., “Check seat health”)
3. Build the workflow in Zapier
- Trigger: HeyReach → New campaign stat or relevant metric (via Zapier or webhook)
- Filter/Math: Evaluate your thresholds (use “Filter by Zapier” step to check if metric is below threshold or drop > X%)
- Action 1: Slack → Send DM or post to channel alerting team
- Action 2: HubSpot → Create Task or update record for follow-up
4. Deploy and test
- Assign owners to each sender seat and tag in Slack for clarity
- Use test data: simulate a drop in reply rate or acceptance rate to verify that alerts fire
- Monitor the first 2 weeks for false positives; adjust thresholds if needed
Why this works?
Because you’re not just monitoring data, you’re operationalizing it.
- HeyReach’s Zapier integration gives you real-time triggers.
- Your Google Sheets baseline + thresholds transform raw numbers into early-warning signals
- Your Slack/HubSpot alert workflow makes sure something happens when it matters – not just a dashboard you might forget to check.
The account health scorecard (your weekly agency ritual)
You’ve automated the alerts. Now it’s time to make accountability part of your agency’s rhythm.
This is your 30-minute weekly ritual to evaluate every client account, spot risk patterns, and assign next actions before they become escalations.
Your 30-minute weekly ops ritual
- Start in HeyReach Master View: Open Master View to see all client workspaces in one place. You’ll instantly know which accounts are trending down – look for campaigns with falling acceptance or reply rates, or growing pending invites.
- Open your Account Health Scorecard (Google Sheets): This is where visibility turns into accountability. Each week, you log outcomes, notes, and who owns next steps. The scorecard gives you a permanent cross-client progress trail – perfect for internal reviews, performance tracking, and client summaries.
- Flag and assign actions: Once alerts fire, filter the Sheet by “Watch” or “Action.”
For each flagged account:- Review recent campaigns in HeyReach
- Diagnose the root cause (targeting, limits, fatigue, or copy)
- Assign an owner and next action.
What your scorecard tracks
Your Account Health Scorecard should include the following columns and campaign insights:
- Client — the company or workspace name.
- Seats — number of active sender accounts currently running campaigns.
- Acceptance trend — week-over-week connection acceptance rate (use a sparkline for tracking metrics visually).
- Reply trend — week-over-week reply rate (also tracked via sparkline).
- Invite backlog — total pending connection requests, pulled directly from the Dashboard Export.
- Flag — status indicator: OK, Watch, or Action, based on your baseline thresholds.
- Owner — the account manager or ops lead responsible for this client or workspace.
- Next action — short note on what needs to be fixed or optimized in the next review cycle.
📃 We built a pre-filled Google Sheets template you can copy and use right away.
Weekly routine checklist
✅ Run Master View scan for all client workspaces
✅ Update the Scorecard
✅ Review flagged accounts
✅ Assign next actions in Slack or HubSpot
✅ Share highlights in your Monday ops sync
Do it consistently, and you’ll spot campaign issues before they reach the client – every single week.
Performance recovery playbook: fix drift fast, the safe way
Even with a solid monitoring system, performance dips happen. The difference between a good ops team and a great one is how fast (and safely) they restore a campaign’s effectiveness.
Actually, recovery speed is one of the biggest predictors of long-term campaign success.
Here’s the playbook with concrete, repeatable actions for the 3 most common delivery drifts – low acceptance, low replies, and invite backlog – with steps directly supported inside HeyReach:
1. Low acceptance rate
What it means: Your audience fit or sender health is slipping. LinkedIn isn’t accepting as many new connections from your campaigns.
What to do:
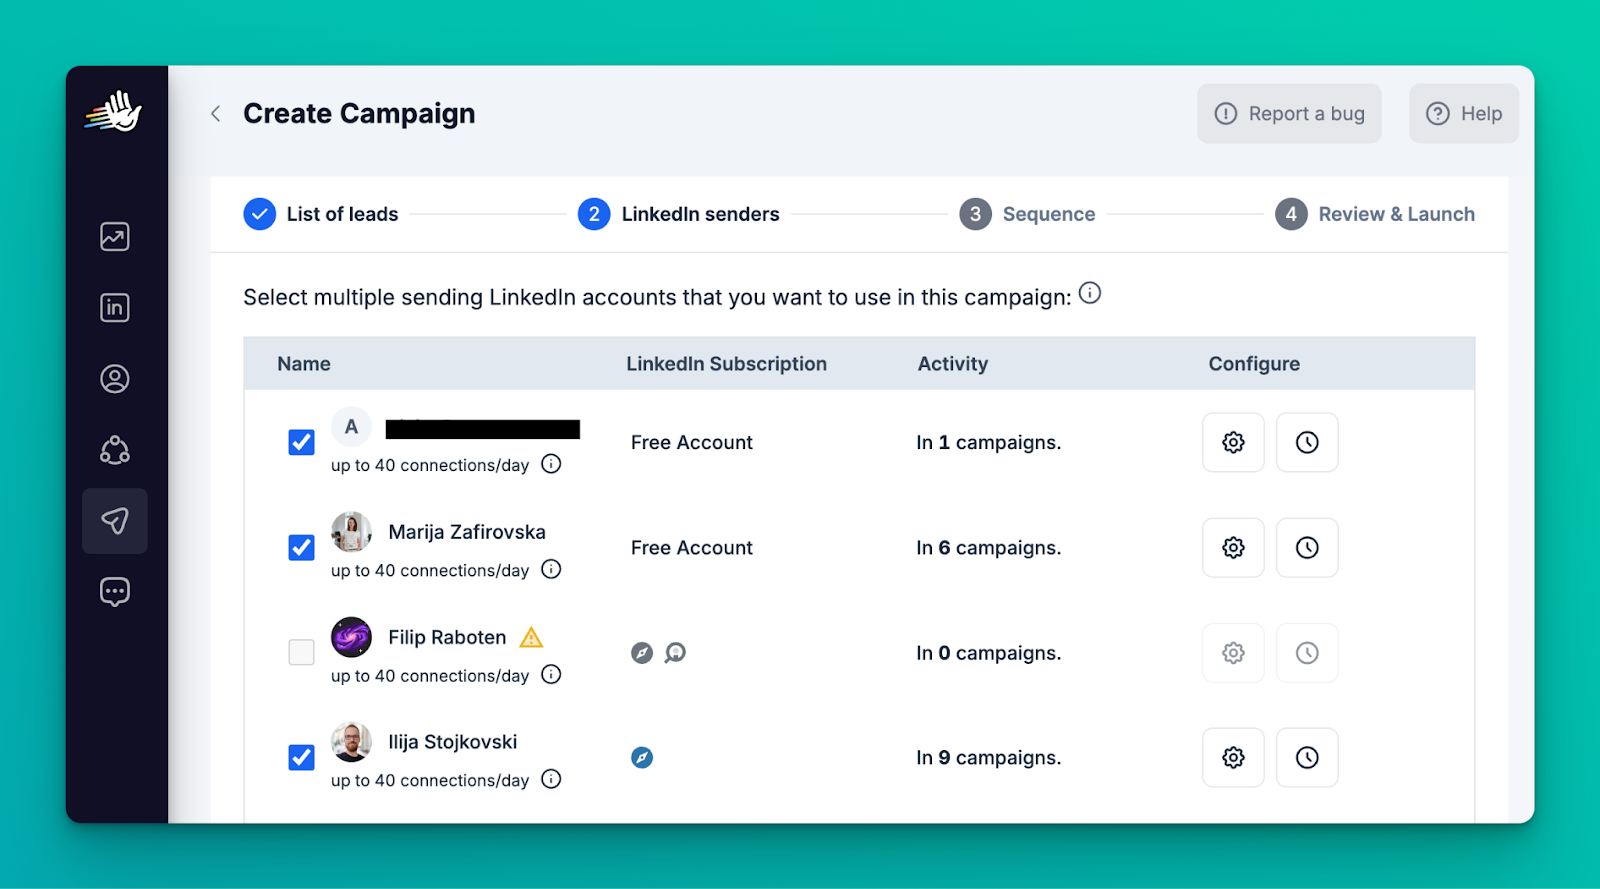
- Tighten targeting. Export your leads list from HeyReach, filter by industry/title, and remove mismatched segments. Quality beats volume.
- Pause the coldest seats for 48–72 hours. In HeyReach, open LinkedIn Accounts → Configure limits and temporarily lower or pause daily send caps for those senders. This allows algorithmic recovery without disrupting other clients.
- Refresh your first-touch message. Edit your campaign sequence with a higher-fit intro (e.g., reference mutual context, avoid generic pitch).
- Pause campaign → edit sequence step → resume safely.
- Pause campaign → edit sequence step → resume safely.
2. Low reply rate
What it means: The message chain isn’t resonating. Follow-ups are too long, the CTA is weak, or the timing is off.
What to do:
- Shorten follow-ups. Keep it to 1–2 concise lines. In Campaign Sequence, trim extra steps that sound repetitive.
- Test a new CTA. Replace “Would you be open to a chat?” with something outcome-based like “Worth a quick sync to compare workflows?”
- Surface social proof earlier. Move credibility markers (client logos, quick value line) into message #1.
- Duplicate the underperforming sequence → apply message edits → assign to new test seats for safe parallel testing.
- Duplicate the underperforming sequence → apply message edits → assign to new test seats for safe parallel testing.
3. Invite backlog (pending requests piling up)
What it means: Too many pending invites are slowing your sender delivery and risking restriction.
What to do:
- Withdraw stale requests. In HeyReach’s LinkedIn Accounts panel, check each sender’s “Pending” count (from Dashboard or export data). Withdraw requests older than 2–3 weeks.
- Rebalance pacing caps. Use Configure limits to temporarily reduce daily connection requests until backlog falls below 800 per sender (LinkedIn safe range).
- Audit sequence delays. If too many actions are stacked, increase the delay between steps (e.g., from 1 day → 2 days) to prevent overflow.
- Adjust sequence delay and limits in one click per campaign.
- Adjust sequence delay and limits in one click per campaign.
4. Bonus: Seat health and rotation
When one sender’s stats stay low across multiple campaigns, rotate it out.
- Duplicate the campaign to a new, warmer seat.
- Pause the original until metrics normalize.
- Keep the account active with low-volume engagement (profile visits, likes) to maintain sender credibility.
HeyReach supports safe seat rotation – you can reassign sequences without resetting campaign history or metrics.
TLDR; Every drift has a safe recovery path. The moment your monitoring sheet or HeyReach dashboard flashes a red flag:
- Pause.
- Diagnose the symptom.
- Apply the right fix without breaking the delivery rhythm.
The insights you get become your playbook for future campaigns and help you avoid repeating the same drift patterns.
Next steps: Turn monitoring into a repeatable ops habit
You've built the system. Now it’s time to make it a weekly rhythm that runs on data-driven decisions instead of assumptions.
1. Make the system visible
- Share your Account Health Scorecard (Google Sheets) with your team and workspace leads.
- Within HeyReach, use Workspaces + Master View to monitor marketing campaigns for all clients from one pane.
- Link the sheet in your team workspace (Slack, Notion) so anyone can check sender health instantly.
2. Automate your data flow
- Use the HeyReach Dashboard Export feature (CSV, PNG, SVG) to feed your Google Sheets.
- Leverage the HeyReach + Zapier integration (or webhooks via API) to trigger alerts, push to Slack or HubSpot.
- Set a scheduled workflow: every Monday at midnight pull performance metrics, append to sheet → check trends.
3. Run the weekly ops ritual
Every Monday:
- Open HeyReach Master View and filter for clients or workspaces flagged “Watch” or “Action”.
- Update your Scorecard: mark Flag status, assign Owner, log Next action.
- Review those flagged accounts: what’s causing drift? Acceptances? Replies? Seat health? Campaign optimization needed ASAP?
- Assign owners & next steps in Slack or HubSpot task.
💡 Keep in mind: Master View = visibility; Scorecard = accountability.
4. Keep optimizing
- Review long-term trends (month-over-month) using your sheet to spot changes in engagement rates, seasonality, or sender fatigue.
- Then refine your entire outbound marketing strategy based on those insights.
When monitoring turns into a system (not a scramble) you gain predictability. Your clients see consistency and your ops team protects long-term return on investment by staying prepared for whatever comes next.
Build control, not chaos
Monitoring LinkedIn delivery and achieving KPIs shouldn’t feel like firefighting.
With all of HeyReach’s built-in analytics tools and features, you can spot trends early, act fast, and prove campaign stability. All in one user-friendly, cost-effective, connected system.
💡 Remember: the best agencies build guardrails that catch small drops and guide smarter decision-making.
When every seat, sender, and campaign runs inside a measurable framework, your ops team gains what every client actually pays for: predictability.
The best part? This proactive control doesn’t just improve outbound, but strengthens all your digital marketing efforts – from LinkedIn outreach to email campaigns, and every social media post in between.
So start with visibility (exports), automate the watchtower (alerts), and make weekly reviews your ritual. Because in outbound, consistency is the real differentiator. And HeyReach is built to help you protect it.
Frequently Asked Questions
Can I do this if my clients use different workspaces?
Yes. With HeyReach Master View, you can monitor all workspaces in a single dashboard. Filter by client, sender seat, or workspace to see which campaigns are healthy and which need attention. Export this view weekly and sync it to your Account Health Scorecard to keep every client’s performance visible and measurable.
What’s the difference between campaign monitoring and campaign analytics?
Campaign analytics explain why something happened. For instance, whether copy, targeting, or timing influenced performance. Campaign monitoring helps you catch when something starts to slip — like a quiet drop in acceptance or reply rates In short: analytics diagnose; monitoring prevents.
Which LinkedIn campaign metrics predict account restrictions or delivery issues?
The four leading indicators inside HeyReach are: Pending requests rising faster than completions → possible connection limits. Daily send volume falling below configured caps → potential throttling. Acceptance rate under 20 % → low audience fit or early restriction signs. Reply rate down > 20 % week-over-week → content or ICP mismatch. These can all be tracked inside Dashboard Exports or the LinkedIn Accounts view. When issues appear, operators can pause campaigns, rotate seats, or adjust pacing caps – all directly inside HeyReach.
How often should I update my Account Health Scorecard?
Once a week is ideal. Make it part of your Monday ops ritual: review alerts, open Master View, update your scorecard, and flag any “Watch” or “Action” accounts. Weekly consistency prevents data gaps and builds a reliable performance trail across all clients.
Can I automate alerts from HeyReach?
Yes. HeyReach supports webhooks and native integrations with n8n, Make, HubSpot, and Slack, so you can route alerts directly into your existing workflows. For example, when acceptance drops below a set threshold, a webhook can trigger a Slack message to the account owner or create a HubSpot task automatically – no extra tools needed. Thanks to its integrations, HeyReach becomes one of your most powerful analytics and monitoring tools, giving you instant alerts, visibility, trend & performance analysis in one place.
.png)