3 LinkedIn KPIs that tell you exactly if your outreach drives pipeline
Published:
October 17, 2025
, Updated:
October 21, 2025
You can send 100 LinkedIn connection requests a week and still have a pipeline flatter than a pancake.
It doesn’t matter how many people you reached out to, so don’t obsess over volume. It’s like bragging about how many people you swiped right on Tinder. Sure, the number might be high, but how many of those led to a meaningful, enjoyable date?
Think of smart LinkedIn outreach as matchmaking: you do some digging on what your prospect needs and cares about before reaching out. Fewer messages, but far better results.
Your focus should therefore be on metrics that measure the effectiveness of your outreach. At the pipeline-entry stage, these are connection acceptance rates, positive replies, and meetings booked.
This article will show you how to track these metrics and take actionable steps to optimize your outreach based on what the numbers tell you.
Vanity metrics vs. real LinkedIn KPIs: what leadership actually cares about
Metrics like click-through rate or ad impressions make sense when you’re running LinkedIn Ads or growing a company page for brand awareness — but they tell you nothing about real conversations and relationships in your outreach.
In the outreach efforts, metrics like “Connections sent” and “profile views” look great and make you look busy and efficient. But do they really matter?
There’s nothing tying those metrics to real opportunities and nothing that proves you’re getting return on investment.
Here are a few common vanity metrics to watch out for:
- Connections sent. Sending a lot doesn’t mean you actually reached or engaged the right people.
- Profile views. People looked at your profile, but did they respond or take action?
- Messages sent. Blasting messages looks busy, but if nobody replies, it’s meaningless.
- Post likes/reactions. Fancy LinkedIn posts with high engagement rate are nice, but they don’t equal meetings booked or SQLs.
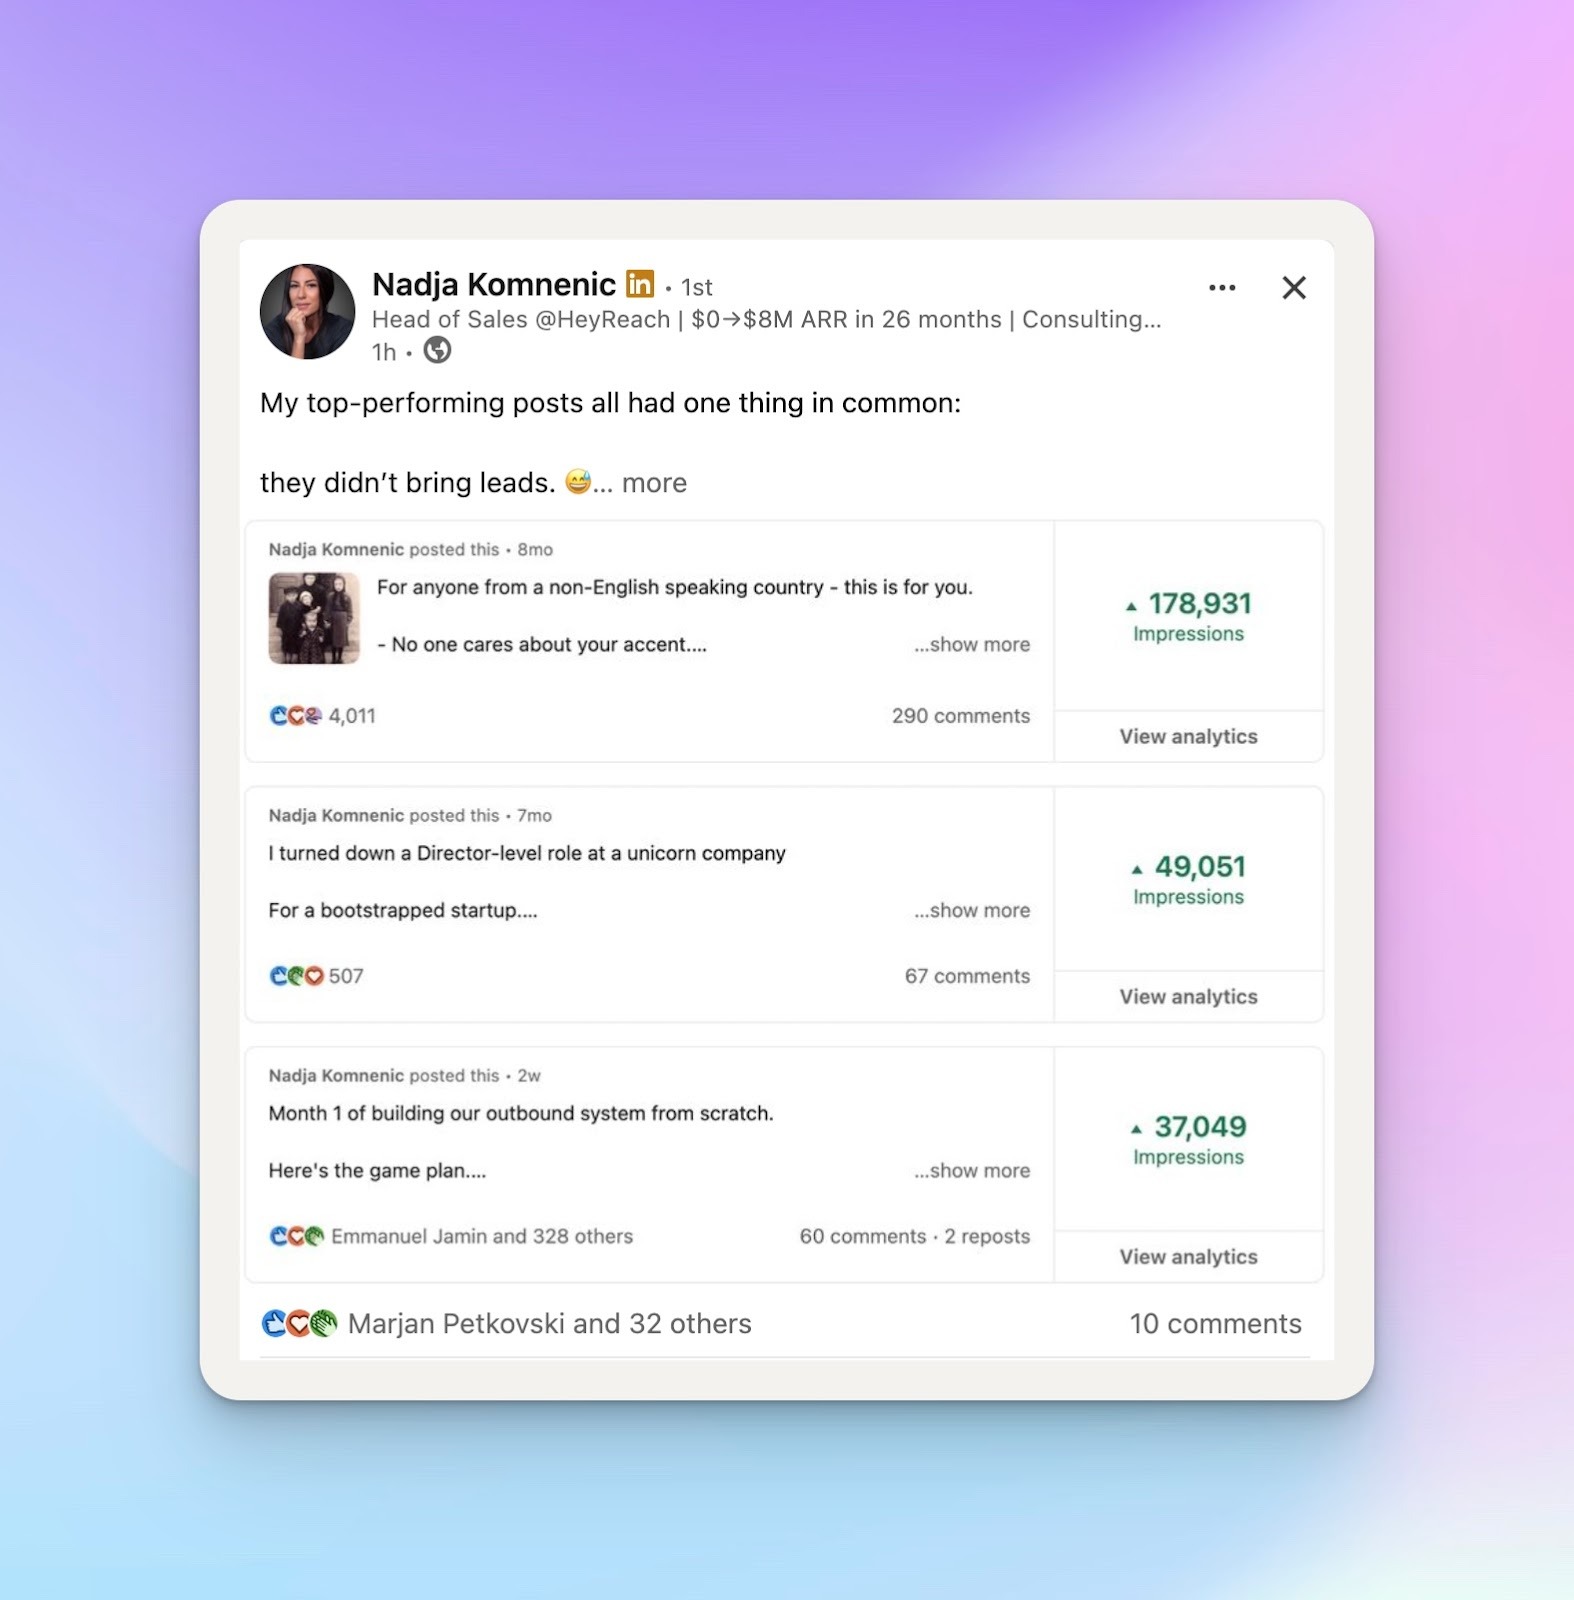
- Nadja Komnenic, our Head of Sales, recently talked about her best-performing LinkedIn posts and how they didn’t bring her any leads. Check out her full post for actionable tips on how to adjust your content for top, middle, and bottom of the funnel so you can build an impactful lead gen system without losing your human voice.
Leadership doesn’t care about these.
They’re focused on results that impact revenue and align with business goals — the metrics that show whether your outreach is creating meaningful conversations, qualified opportunities, and predictable deal value.
Next, we’ll dive into the three key LinkedIn key performance indicators that actually move the needle. The ones you can track easily, see trends on, and casually drop in your boss’s inbox to prove you’re making impact. 😉
The 3 LinkedIn KPIs that impact conversion rates
For meaningful LinkedIn outreach that brings measurable results, pay attention to these 3 key metrics.
Connection acceptance rate
Connection acceptance rate is your entry-gate metric — basically, it measures your outreach quality and ICP (Ideal Customer Profile) targeting.
If people aren’t accepting your requests, the rest of your metrics (replies, meetings…) won’t matter, because you haven’t opened the door yet.
How to calculate your connection acceptance rate
Here’s a simple formula:
(Accepted ÷ Sent) × 100
For example, you sent 50 connection requests last week, and 15 were accepted.
(15 ÷ 50) × 100 = 30%
Your connection acceptance rate is 30%, which falls within the healthy acceptance rate range (25-30%). If it’s higher than this, you’re golden. If it’s lower, you’ll need to zoom in on your ICP and make some tweaks to your profile and outreach strategy.
How to improve your connection acceptance rate
- Optimize your LinkedIn page. Make your headline clear, highlight relevant experience, talk about how you’re solving your ICPs’ problems, and have a professional headshot. This will make you look credible and trustworthy.
- Personalize connection notes. Find a common ground or something specific (their recent post, webinar, or industry news) to reference in your LinkedIn message.
- Target warm connections first. Start with warm 2nd-degree connections first, for higher acceptance rates.
Strategic tweaks for better connection acceptance rates
- Improve LinkedIn prospecting by refining your ICP. Focus on prospects whose demographics match your ideal customer profile (industry, role, location, company size), so your connection requests are more relevant and more likely to be accepted. Use standard LinkedIn filters, Boolean search, and Sales Navigator to create a list of prospects that completely fit your ICP.
- Improve the lead qualification process by establishing different systems for filtering out your leads. This is best done through automation, and some of the qualifying processes you can use are BANT (Budget, Authority, Need, Timeline), CHAMP (Challenges, Authority, Money, Prioritization), MEDDIC (Metrics, Economic Buyer, Decision Criteria, Decision Process, Identify Pain, Champion), or ANUM (Authority, Need, Urgency, Money).
Dive into this LinkedIn lead generation strategy guide to master how to narrow down your audience, craft messages that boost connection acceptance rate, and improve prospecting and qualifying (All acronyms mentioned above are explained in detail).
Positive reply rate
On the surface, your 50% reply rate looks awesome, and you’re ready to flex to your manager. But then you actually read the messages… and most of them are “Not interested, thanks.” Oh, the drama.
This is exactly why you should focus on the positive reply rate, as that’s the metric that tells you who actually wants to talk.
How to calculate your positive reply rate
The formula is:
(Positive replies ÷ Accepted connections) × 100
For example, you sent 50 connection requests and 20 were accepted. Out of those 20 accepted connections, 6 people replied positively.
(6 ÷ 20) × 100 = 30%
So your positive reply rate is 30%.
In this example, 30% is decent, but there’s still room to improve — you want to shoot for 40% or more, and anything below 20% is not ideal.
How to improve the positive reply rate
- Test different value propositions by highlighting different benefits depending on what matters to each prospect.
- For example, imagine selling HeyReach to different clients: a small startup, a lead gen agency, and a corporation.
- Each has unique problems (startups have small teams, need pipeline fast, tight budget; lead gen agency needs an effective way to manage multiple clients, scale campaigns, save time; enterprises focus on compliance, reporting, ROI).
- So you’d approach each prospect offering different benefits and different functionalities and integrations that HeyReach offers. It’s not a one-size-fits-all approach.
- Avoid pushy CTAs in early messages. Asking for a meeting in the first message often turns people off. Start with curiosity, insight, or a question. Understand your leads before jumping to say how you can help them. Sometimes it’s a slow burn, but it’s really effective.
- Use social proof. Mention companies you’ve helped or relevant metrics to show credibility and build trust. If you’re already doing good work with professional networking, staying active on LN, connecting with the right people, and sharing your story, chances are people will start approaching you. And this will make the social proof part way easier.
Meeting booked rate
This is the KPI of the pipeline-entry stage. The MVP of KPIs.
Acceptance and replies are important, but meetings are the first palpable proof that your outreach is working.
How to calculate your meeting booked rate
The formula is:
(Meetings ÷ Positive replies) × 100
Say you had 12 positive replies last week, but only 1 person booked a meeting:
(1 ÷ 12) × 100 = 8%
A good rule of thumb is that 20–30% of positive replies should convert into meetings.
Keep in mind that this can vary depending on ICP quality and the length of your sales cycle (for example, some prospects naturally take longer to commit).
In this example, an 8% meeting booked rate is well below the benchmark. You’re getting positive replies, but very few are turning into actual conversations. This signals a need to adjust your approach.
How to improve your meeting booked rate
- Use friction-free CTAs. A simple question like “15-min call?” works better than heavy asks like “let me show you a demo.”
- Respond quickly to positive replies. No pressure, but the faster you engage, the higher the chance they’ll book a call.
- Make scheduling easy. Offer clear options (Calendly is your friend) and make rescheduling simple.
- Build your LinkedIn reputation. Post regularly, connect with people in a meaningful way, and provide value. It’ll help you build a reputation as a trustworthy expert, so prospects are more likely to say “yes”. This is a long-term LinkedIn strategy, but boy, it pays off.
Other metrics to watch out for
There are other numbers you’ll see floating around, and some can provide extra context on how well you’re doing:
- SQLs. More SQLs means a larger pool of deals that can convert into revenue. It’s the clearest early indicator of how many opportunities your outreach is putting into the funnel.
- Follow-up reply rate. Knowing what gets you responses will help you refine messaging and sequence timing. (Nikola Velkovski, CEO here at HeyReach, shares a few tactics for writing follow-up messages that bring more replies).
- Time-to-first-reply. Tells you how quickly prospects respond, which can indicate engagement and urgency.
👉 Bottom line: Track what impacts the pipeline, ignore the noise. Your focus should always be on the quality of conversations over the quantity of activity.
How to track KPIs without tools
Now that you know what you’re looking for, here’s the easy way to track it.
Step 1: Create a sheet
Create a Google Sheet with these columns:
- Sent
- Accepted
- Acceptance Rate
- Positive Replies
- Positive Reply Rate
- Meetings
- Meeting Booked Rate
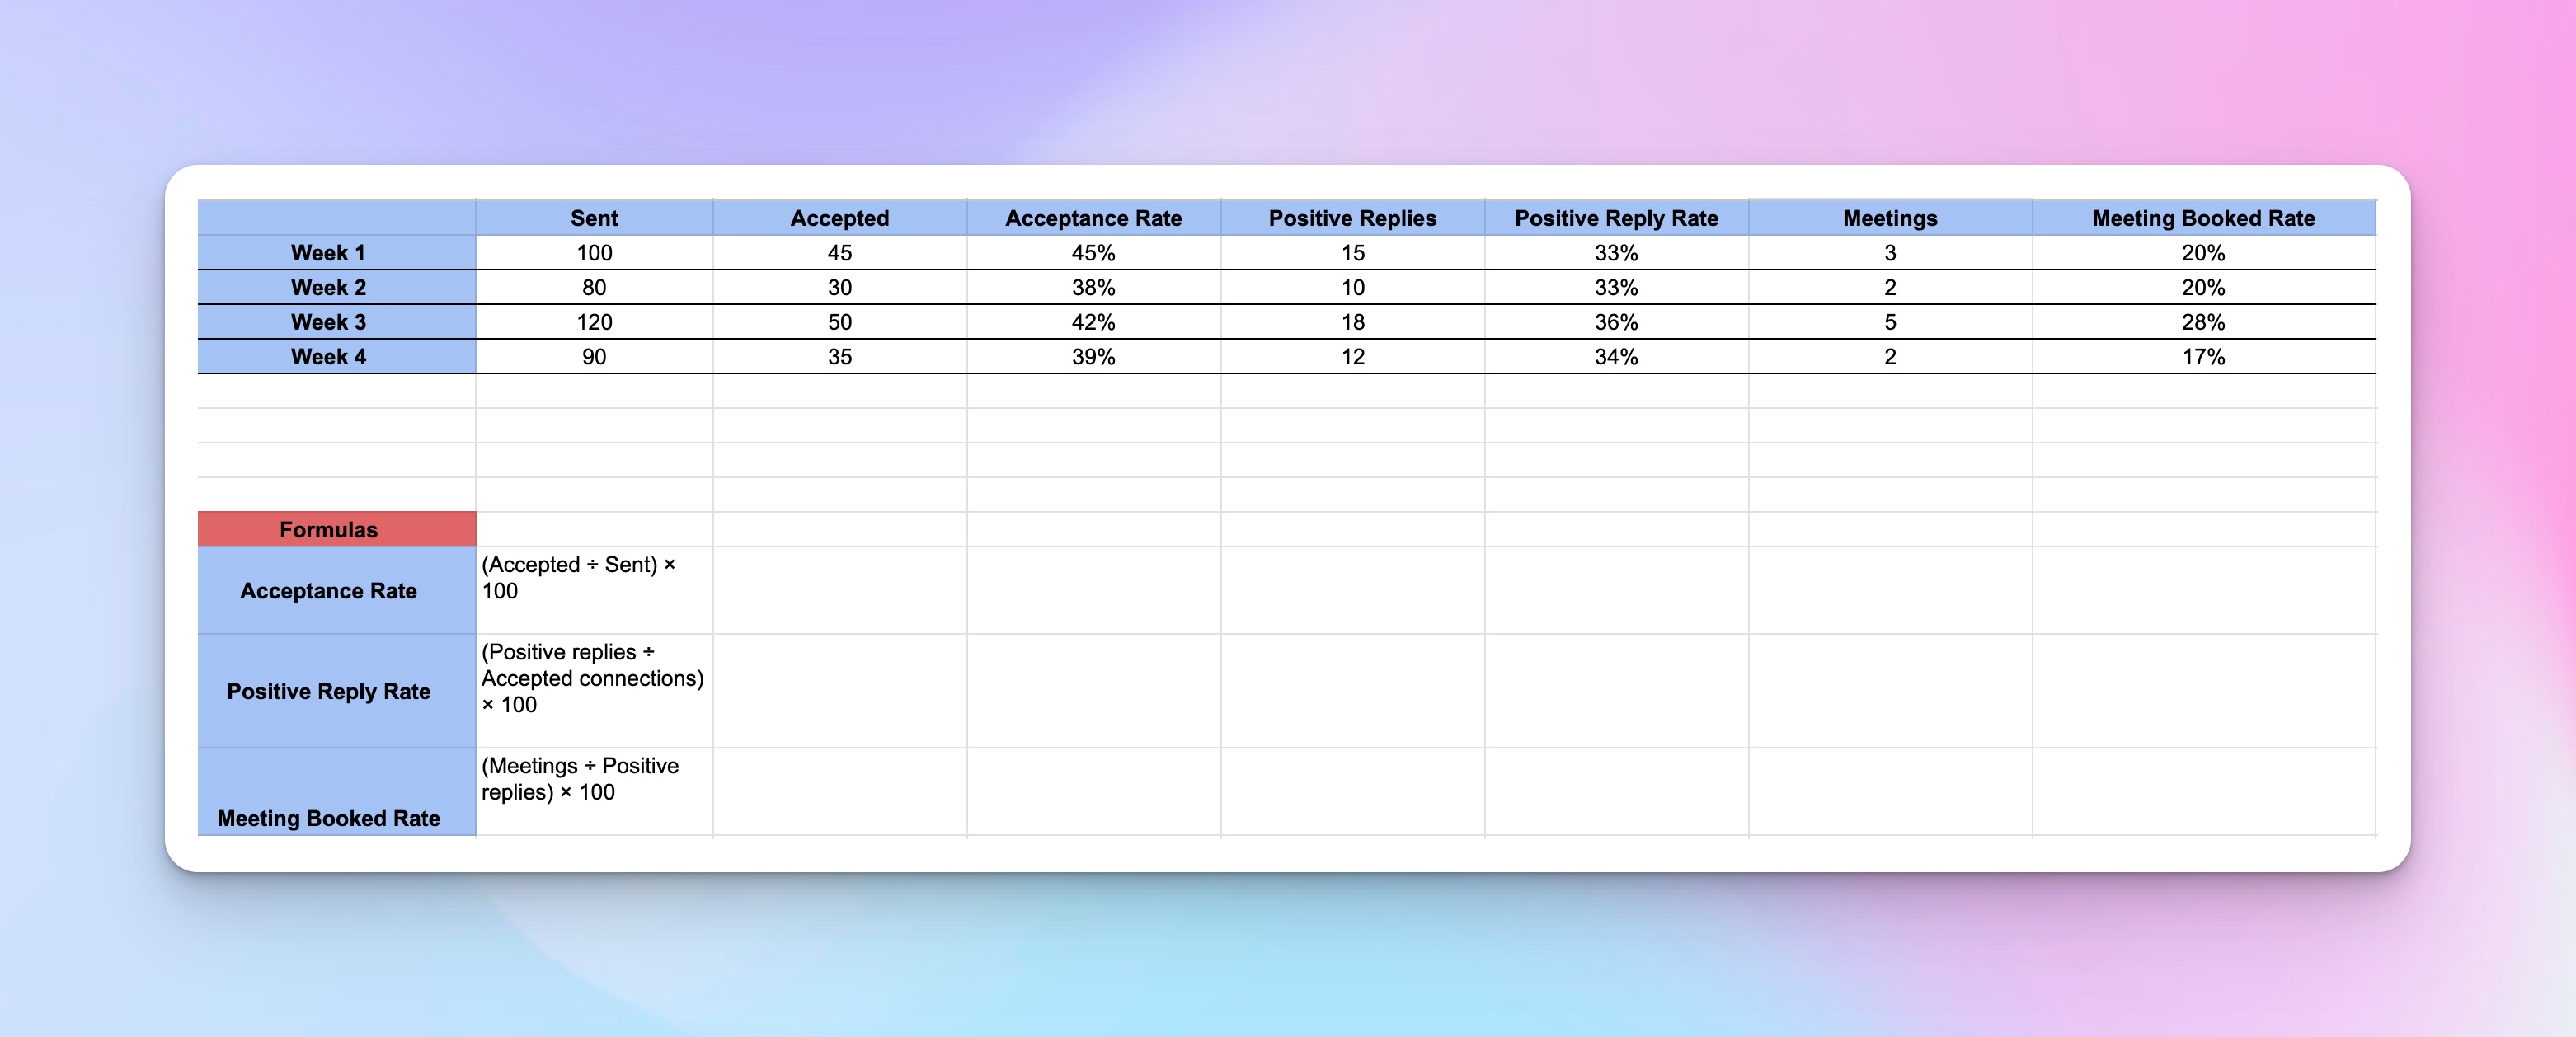
This is your activity tracker. You’ll enter daily or weekly totals — whatever feels easiest to maintain. In this example, I used weekly totals. (Btw, this simple sheet will often tell you more than LinkedIn Analytics because it gives you audience insights that focus on action, not just the total number of views or likes.)
You will manually add the number of sent connections, accepted connections, positive replies, and meetings.
The remaining 3 columns (Acceptance Rate, Positive Reply Rate, Meeting Booked Rate), you will calculate using the formulas we provided in this article, and then add them to their respective fields.
Add rows for weeks or months you’re tracking, and your sheet will look something like this:
Step 2: Track trends and patterns
Look at your acceptance, positive reply, and meeting booked rates over several weeks.
Are they going up, staying flat, or dropping? This tells you whether your targeting and messaging are improving.
You can also add a new column for Notes for campaign overview, details, and context: “Tested new connection note,” “Targeted 2nd-degree connections,” or “Outreach to SaaS founders.” Over time, you can see which tactics consistently improve your rates and what works with which target audience.
As you play around, you can start adding new columns, look at ratios instead of raw numbers, and use conditional formatting (green for high, red for low) to instantly see which weeks performed best or worst.
👉 Bottom line: Start small and track consistently for a few weeks. Just seeing how your numbers move over time will give you new ideas on what to test.
This is where it gets complicated, though.
As weeks and months go by, your sheet will start to get crowded. Add in your coworkers’ numbers, and suddenly you’re juggling multiple tabs, manually calculating averages, and wasting hours trying to pull together reports for your manager. It works, but it’s messy and time-consuming.
At some point, it’s worth thinking about automating the whole process — keeping everything neat, in one place, and saving hours of manual work.
From metrics to action: What to do when KPIs are off
Alright, alright, alright… (Channeling my inner McConaughey).
You have the numbers. They’re not ideal. Now what?
Here’s a simple “If X is… → do Y” playbook to turn your data into action.
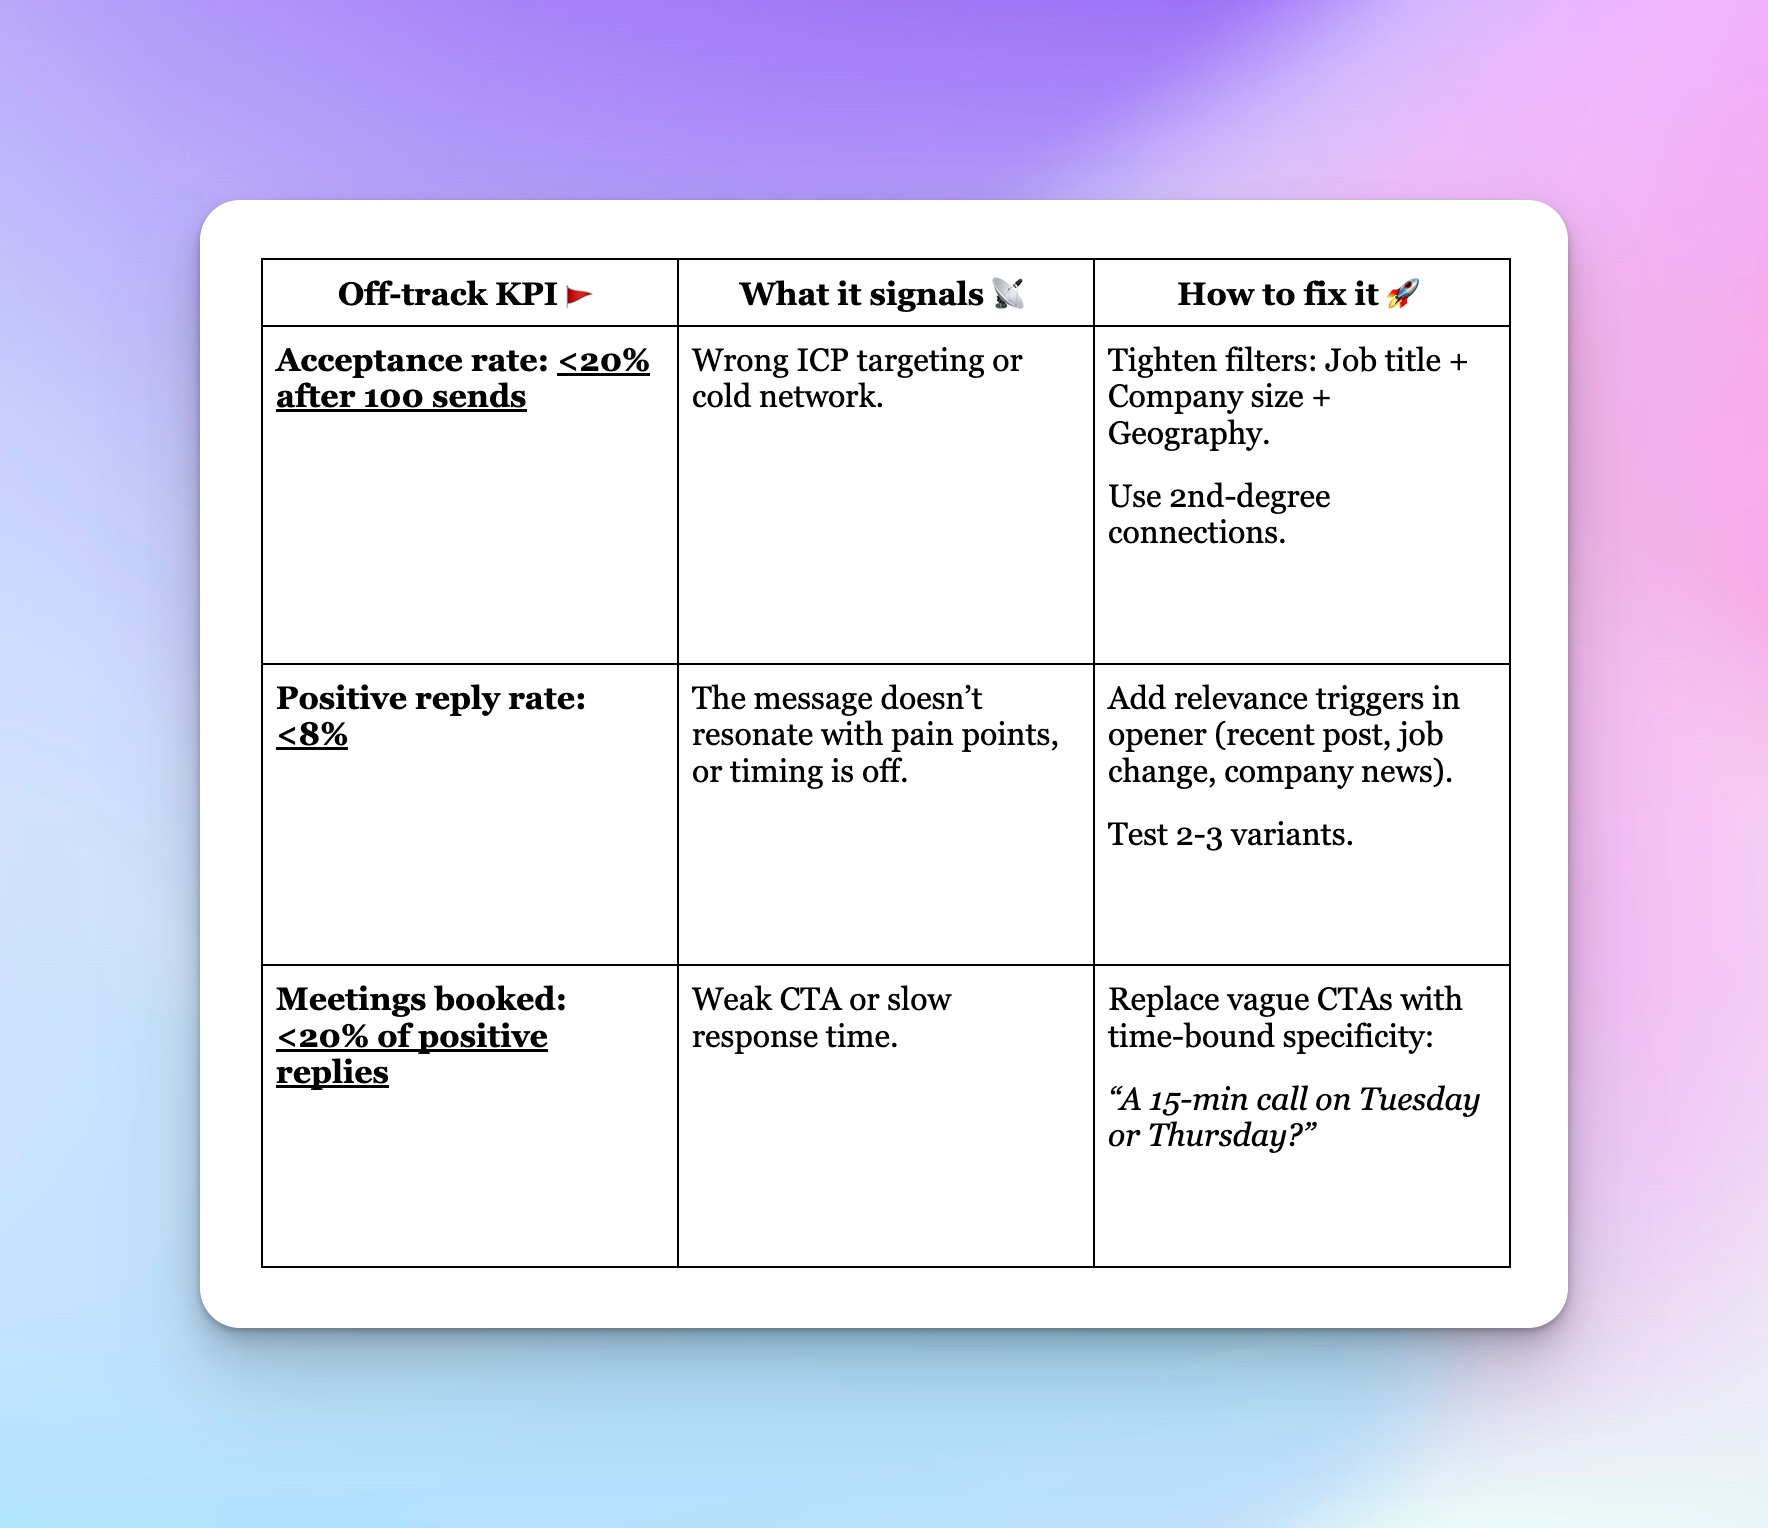
Challenge 1: Acceptance rate is <20% after 100 sends
This usually means your targeting is off or your network is too cold.
A simple way to improve this is by tightening your filters — combine job title, company size, and geography, and prioritize 2nd-degree connections who are more likely to engage.
For example, Craftgenn narrowed their ideal client profile from “marketing directors” to “marketing directors at 50–200 employee SaaS companies.” By getting this specific, their acceptance rate jumped to 29%, and they landed a $10K deal.
Bottom line: Small tweaks in targeting can have a big impact.
Challenge 2: Positive reply rate is <8%
It’s a signal of weak outreach messages. Either you didn’t hit the pain point, or timing is off.
Adding relevance triggers to your opener can help. Reference a recent post, a job change, or company or industry news. Test a few message variations to see what’s the best way to connect with them.
Keep in mind that low reply rates can sometimes be a content strategy issue. Irrelevant landing pages can drag down campaign performance even if your leads are high-quality.
Make sure you’re contacting them at the right time, too. For example, fast-paced industries (SaaS startups, e-commerce, digital marketing) often respond well to quick follow-ups. They’re used to rapid decision-making and don’t mind a little nudging.
On the other hand, regulated industries like finance, healthcare, or enterprise tech prefer more breathing room. Too many messages in quick succession can feel pushy.
To stay safe, use data from past outreach to track response timing for your ICP segments. If 70% of replies in one industry come within 24 hours, you can shoot that follow-up campaign quickly. Conversely, if most replies take 3–5 days, give them space. Patterns often emerge after a few weeks of consistent tracking.
Linkunity’s team focused on timing when reaching out to real estate leads, as it’s an important factor in the real estate industry. They would send a connection request without an accompanying message, and then message them within three hours of the connection acceptance.
The result was a 26% positive reply rate.
Challenge 3: Meetings booked <20% of positive replies
Here, the problem is usually a weak CTA, or you’re being slow to respond.
Make your ask clear and easy to act on. Instead of ending with a vague “Let me know if you’re interested,” get specific: “Would a quick 15-min chat Tuesday or Thursday work?”
Ilija Stojkovski, the CRO here at HeyReach, dissected a cold message he received, and you can see in practice how easy it is to miss an opportunity by pitching a vague idea or being too subtle and general with a call-to-action.
Common pitfalls
I hope you’re pumped to start tracking metrics that matter by now. But before you do, let’s go over some common mistakes I’m seeing sales teams make and how to prevent them.
1. Tracking inconsistently
Manually updating your tracker whenever you remember means your data will be spotty and unreliable. The trick is to make it a routine; 5 minutes every Friday or at the end of each campaign. Consistency > perfection here.
(Also, don’t fall into the social media marketer mindset of checking your numbers daily, like follower growth rate or engagement spikes. This isn’t about the algorithm, it’s about long-term improvement.)
2. Mixing up tagging or categories
If you’re not tagging your outreach types, ICP segments, or campaigns consistently, your insights will be a mess later. For example, calling one lead “Marketing Director” and another “Dir. of Marketing” will break your filters and reports.
The same applies if you’re trying to calculate cost per lead or cost per conversion later. Inconsistent data makes it impossible to know what’s actually working.
Standardize your naming before scaling.
3. Scaling before you have benchmarks
Don’t pour fuel on something that’s not lit yet. If your acceptance rate is still below 20%, or your reply rate is under 5%, scaling only amplifies the inefficiency. Hit your baseline benchmarks first and then ramp up volume.
4. Ignoring CRM sync (or not having one at all)
If your outreach data lives in a Google Sheet but never makes it to your CRM, leadership can’t connect the dots between outreach and pipeline.
That’s how outreach teams end up invisible to sales.
Even a simple manual sync (copy-paste once a week) keeps everyone aligned.
(But I have a better solution for you, so keep reading. Speaking of alignment, here are a few ideas on how to align sales and marketing without status meetings).
Next steps: build habits and scale with confidence
Let’s see how you can make a habit of KPI tracking, and when’s the right time to scale.
Weekly KPI review
Set aside 15–20 minutes once a week to update your sheet and check what’s happening.
Doing it a number of times with a cup of coffee and an ‘80s playlist will make it something you look forward to.
It’s fairly simple:
- Update the numbers. Enter sent connections, accepted connections, positive replies, and meetings from the past week.
- Calculate rates. Remember:
- Connection acceptance rate: (Accepted ÷ Sent) × 100
- Positive reply rate: (Positive replies ÷ Accepted connections) × 100
- Meeting booked rate: (Meetings ÷ Positive replies) × 100
- Add notes, like context, changes in numbers, A/B tests you did…
- Compare with previous weeks to see what’s working and what needs tweaking.
How to scale your efforts
Once the weekly reviews become a habit, you can start thinking about leveling up your game by adding different columns or tags for segmentation, adding additional metrics to follow, etc.
At this point, automating the process will help you reach more people, measure your efforts effectively, and make reporting a breeze.
A few examples:
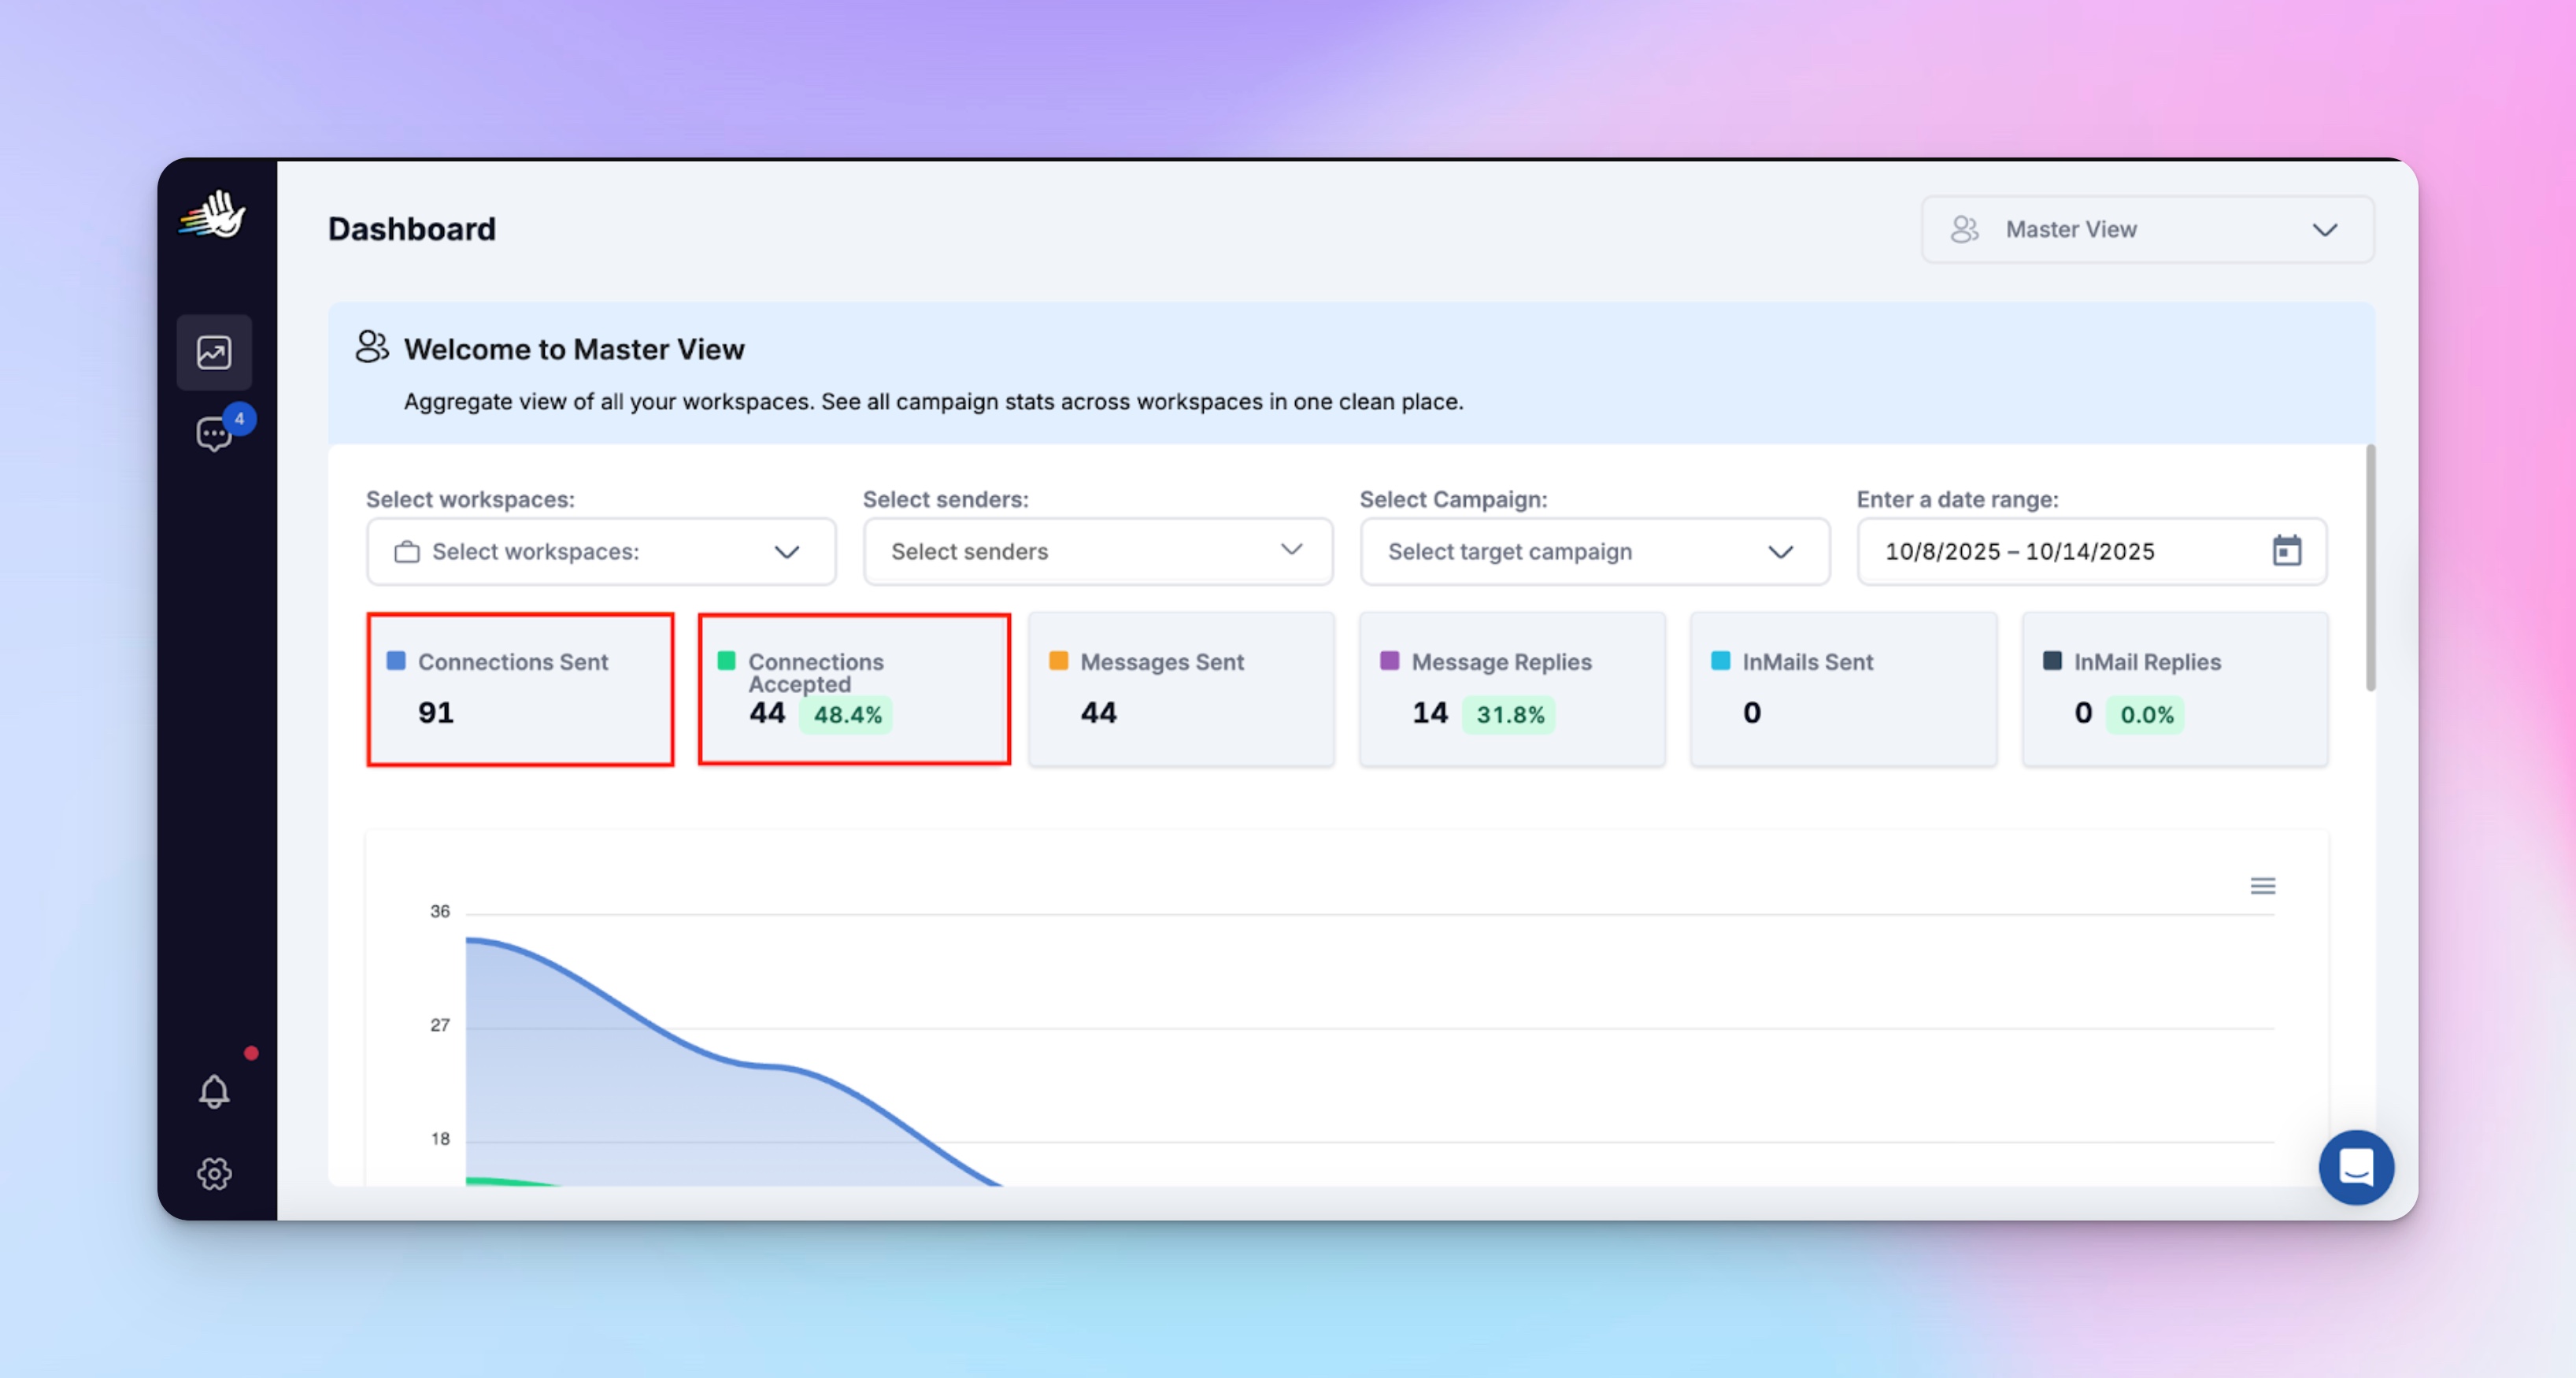
- HeyReach dashboard will help you keep track of the number of connections sent and accepted, so you won’t have to waste time going through your LinkedIn profile and notifications. You can also see message reply rate or InMail replies, quickly check past performance by filtering the dates, and generally make your life easier by downloading a report instead of switching between your LN profile, Google Sheets, and that poor Canva report template.
- Once your team starts scaling, you’ll be able to keep track of all replies from all accounts via Unibox, where you can also add tags to replies to easily remember leads and start where you left off (“Hot lead”, “Meeting”, “Not now”, “No budget this quarter”...). You can add any tag you want to make your life easier:
- Once you’ve booked a meeting with a lead, you can tag them as “Meeting Booked” in Unibox, and then choose the “Export to CRM” option to push the conversation into HubSpot, Salesforce, or as a CSV file — so you’re basically syncing your LinkedIn outreach efforts with your sales pipeline. Plus, you’ll have a single source of truth for the entire team, and connect your top-of-funnel activity with revenue, ‘cause once leads are in the CRM, you’ll be able to track how many meetings turned into a deal.
Bring it all together: focus on LinkedIn KPIs that bring results
Remember, your ultimate goal is to build a healthy, predictable pipeline and predictable revenue.
The metrics that matter aren’t vanity numbers like connection volume, but performance signals that show traction: connection acceptance rate, positive reply rate, and meeting booked rate.
Start by tracking these manually to understand how your outreach performs, where leads drop off, and what moves people down the funnel. Once that habit clicks, it’s time to automate.
Tools like HeyReach take the heavy lifting off your plate by automatically pulling key KPIs into one dashboard, organizing and tagging replies in Unibox, and syncing booked meetings to your CRM.
Instead of crunching numbers, you’ll be learning from them.
Don’t just take our word for it. Take all these features for a ride and see how they work in practice with a free trial — no credit card details needed. If you need ideas or want strategies and tactics that will work for your outreach efforts, book a call with our outbound coach and Head of Sales, Nadja.
Try it for free
Frequently Asked Questions
What are the most important LinkedIn outreach KPIs to track in 2025?
The most important LinkedIn outreach KPIs to track in 2025 are the ones that actually show how effective your outreach is, not just how busy you look. Focus on your connection acceptance rate, positive reply rate (how many want to keep the conversation going), and meetings booked (the ultimate sign your outreach is working). These three tell you if your targeting, messaging, and follow-ups are actually leading to opportunities.
Can I measure LinkedIn KPIs manually without HeyReach?
You totally can, even if it takes a bit more elbow grease. Create a Google Sheet with different columns for different KPIs you're tracking, and then use the formulas we provided in this article to calculate acceptance rate, positive reply rate, and meeting booked rate each week. The downside is that it can get messy once you’re running multiple campaigns or collaborating with a team. That’s when an automation tool like HeyReach can be a lifesaver.
How do you calculate cost per SQL for LinkedIn outreach?
Cost per SQL = Total marketing spend ÷ Number of SQLs generated. Keeping an eye on this metric helps you see how efficiently your outreach turns effort into sales-ready opportunities, and whether you’re getting a good return on your investment.
How do I prove LinkedIn outreach ROI to leadership?
Connect your activity metrics to business results. Start by tracking how many connections and conversations turn into SQLs, meetings, and closed deals, as these are the clearest signs your outreach drives revenue. Then, calculate your cost per SQL and cost per meeting to show efficiency, and compare those to the value of the deals that came from LinkedIn. Add context, too: show how optimizing your messaging improved acceptance or reply rates over time.
How does HeyReach help automate LinkedIn KPI tracking and reporting?
HeyReach automates LinkedIn KPI tracking by keeping all your outreach data in one dashboard, so you don’t need messy spreadsheets. The Campaign Analytics Dashboard tracks metrics like acceptance rate, reply rate, and InMail reply rate, while Unibox helps you keep all conversations in the same place and tag them so organization is easier. You can also export results to your CRM to connect LinkedIn outreach directly to revenue, integrate HeyReach with tools like Clay and Trigify for high-quality leads and clean data, and so much more.