Low reply rate on LinkedIn? Use RTA to find exactly what's broken
Published:
May 31, 2026
, Updated:
June 1, 2026
I've been in enough GTM post-mortems about cold outreach to know how this goes.
The campaign runs for a few weeks. Acceptance looks decent — 25%, maybe 28%. But replies are flat. So the sales team changes the copy. Replies stay flat. Then they change the audience. Still flat. Then someone suggests rebuilding the sequence entirely.
And nobody stops to ask: which part is actually broken?
That’s the real problem in B2B sales →the metric.
Reply rate is a blended number. It combines how well you're targeting and how well you're messaging into a single percentage, which means it can't tell you which one is broken.
You can have two completely different problems show up as the same reply rate. And when you don’t know where to look, you change everything and learn nothing.
Across 96,051 outreach campaigns in the HeyReach dataset, 10.7% of campaigns with accepted connections got zero replies at all.
Not low replies — zero.
That means the targeting worked. The connection was accepted. And the conversation still never started.
This is where most teams misread the problem. They look at response rate and assume targeting is off — when the breakdown is actually happening after acceptance, inside the message or sequence.
That’s exactly what RTA isolates.
The data to answer that question is already sitting in your HeyReach campaigns — you just don’t look at it the right way.
Why your LinkedIn reply rate is low (and why it misleads you)
You can have one campaign with poor targeting and another with a weak opener — both show the same response rate.
Same number. Completely different problems.
That’s why response rate can’t tell you what to fix.
It blends targeting and messaging into one number — so when it drops, you don’t know which part actually failed.
What is reply-to-acceptance rate (RTA)?
Reply-to-acceptance rate (RTA) isolates what happens after the connection is accepted.
Unlike cold email — where engagement rates across opens, clicks, and replies give you multiple diagnostic layers — LinkedIn outreach gives you one blended number by default. RTA fixes that.
RTA (%) = (Replies ÷ Accepted connections) × 100
Instead of looking at everyone you messaged, it looks only at the people who accepted.
If your RTA is low, targeting isn't the issue — they already accepted. The breakdown is happening inside your LinkedIn messages or sequence.
If your RTA is strong but reply rate is low, the issue sits earlier — targeting, list quality, or acceptance friction.
This turns one blended outcome into two clear diagnostics:
- Reply rate → overall campaign outcome
- RTA → post-acceptance conversion
Reply rate tells you what happened. RTA tells you where it broke.
Note: One nuance worth paying attention to: not every reply carries the same intent. A campaign can produce plenty of replies while generating very few genuinely interested conversations. HeyReach’s Positive Reply Detection adds an intent layer on top of RTA by automatically separating positive replies from generic responses or polite objections.
How to calculate RTA from your campaign data
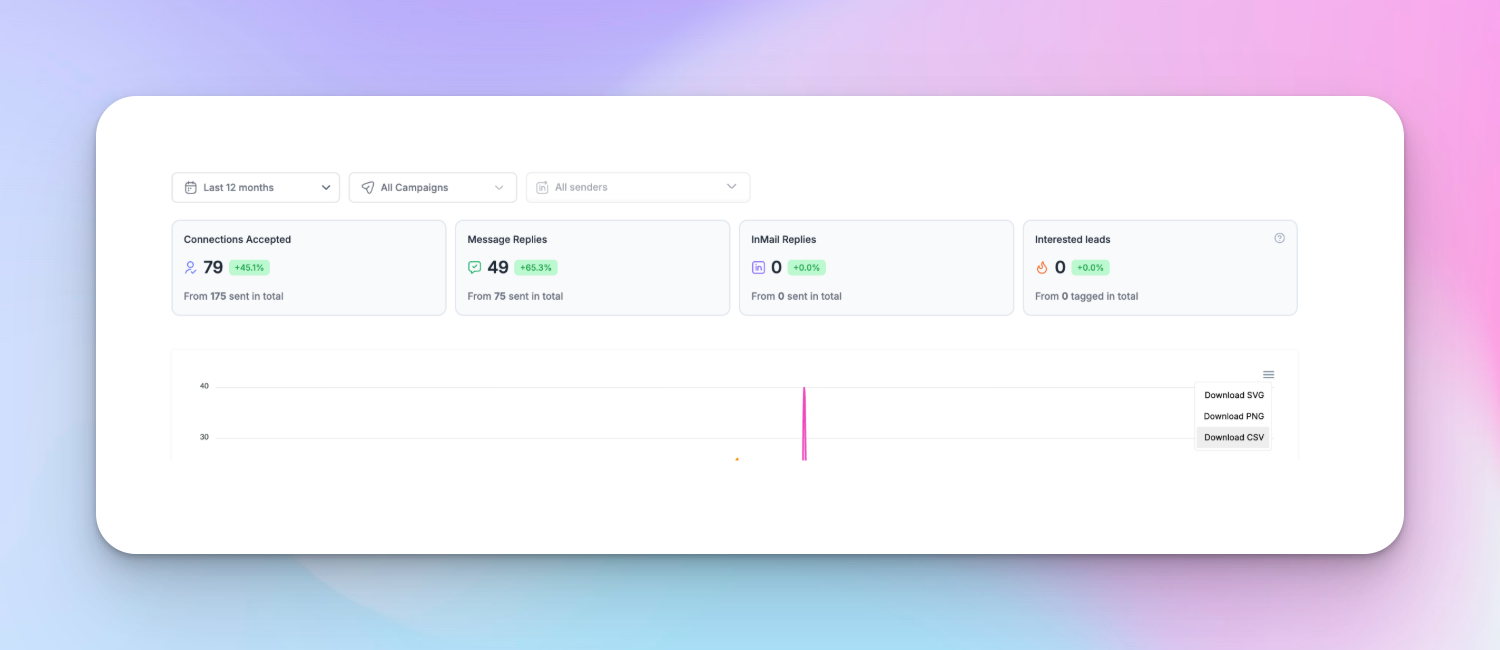
You need two numbers from your HeyReach export: accepted connections and replies.
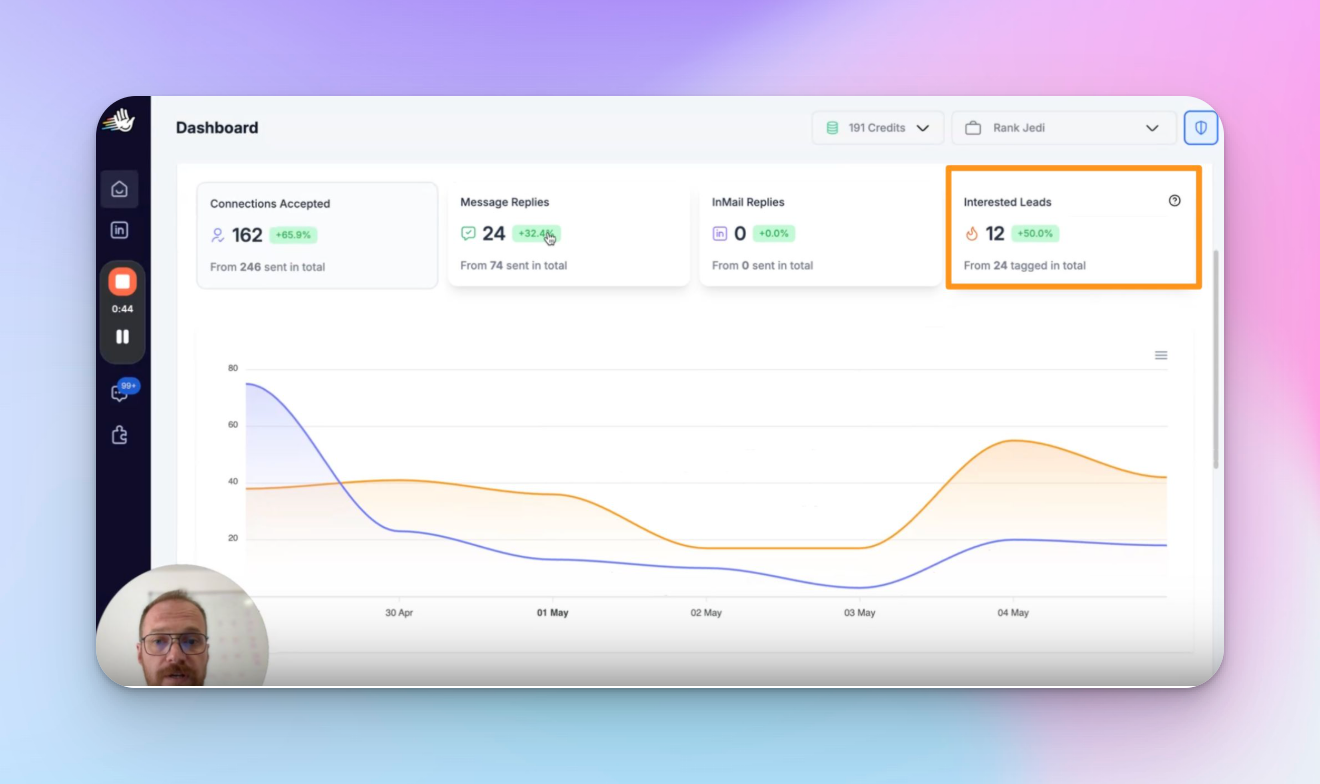
Go to HeyReach Dashboard → select your campaign → Export CSV
RTA = replies ÷ accepted connections × 100
Run this per campaign — not blended. Patterns only show up at the campaign level. One aggregate number tells you nothing.
Optional (Google Sheets):
=B2/A2*100
(Column A = accepted connections, Column B = replies)
RTA isn't a native dashboard metric in most LinkedIn automation tools — which is exactly why most teams miss it. The ones who track it diagnose faster and optimize their sales strategy before it stalls.
Use this on campaigns with enough volume to show a signal — directional patterns start to stabilize around ~100 accepted connections per campaign.
For A/B tests, ~50 accepted connections per variation is enough to read a directional result.
The 3 RTA patterns that show exactly what's broken
The RTA pattern model uses three patterns to identify where your outreach strategy is breaking: messaging, sequence, or ICP–message fit.
A single RTA number doesn't tell you much on its own. The behavior of that number across your campaigns is what tells you where to look.
Pattern 1: Low and flat RTA across all campaigns
Your opening LinkedIn message is failing after connection.
What it looks like: RTA sits below ~15% and stays flat. Doesn't matter which audience you target or how many campaigns you run — the number doesn't move.
Why it happens: The opener reads like a pitch. No specific context, no pain points the prospect recognizes as theirs, nothing that makes a reply feel worth the effort. They accepted the connection out of professional habit. Then your first LinkedIn message confirmed every instinct they had to stay quiet.
What to fix: Rewrite Step 1 to anchor around one specific problem — not your value proposition, not a meeting ask.The goal of the opening message is a reply, not a conversion. Your call-to-action (CTA) should feel like zero commitment — a question, not a calendar link. A first message that names a real problem builds trust — a pitch tears it down before the conversation starts. Reduce the ask to near zero.
Here's what the difference looks like in practice:
❌ Broken: "Hey {{firstName}}, would love to connect and explore how we might work together — happy to jump on a quick call."
No context. No specific reason you're reaching out to this person. Generic templates read exactly like every other pitch they ignored this week.
✅ Fixed: "Hey {{firstName}}, saw you're running outbound at [company] — curious how you're handling reply drop-offs after connection acceptance. Seeing that pattern across a few campaigns myself."
One specific problem. A soft signal that you've thought about their situation. Replying doesn't require committing to anything. The difference isn't personalized outreach for its own sake — it's relevance. You're naming a problem they actually have, in language that makes them feel like you're a peer, not a vendor.
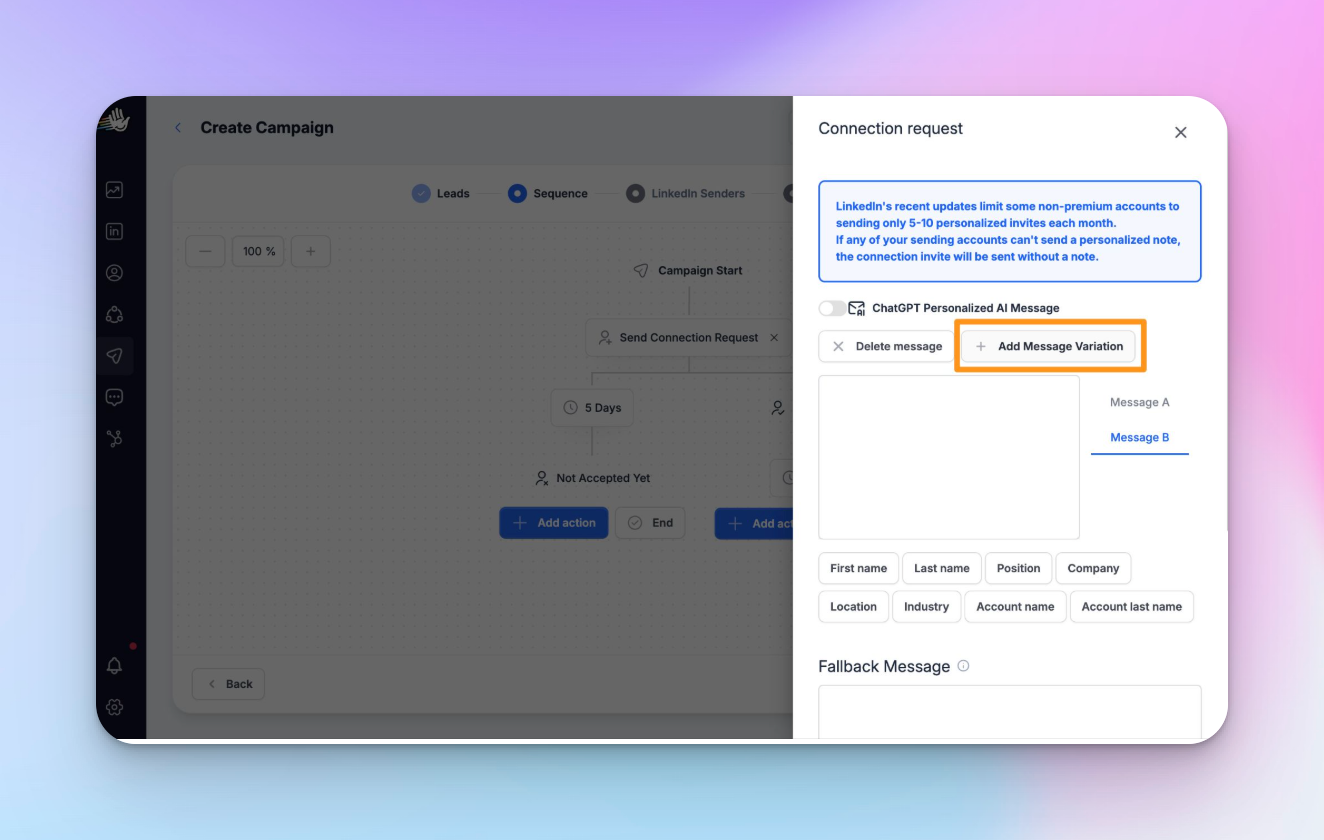
Campaign Builder → Step 1 → Add Message Variation to A/B test the rewritten version against your current opener.
Pattern 2: RTA drops across campaign duration (secondary signal)
Your follow-up sequence isn't doing enough work.
If you're deciding between Pattern 1 and Pattern 2, start with Pattern 1 — it's the higher-probability cause by a wide margin. Check Pattern 2 only after you've validated your opener.
What it looks like: Connections accepted in week one reply at a decent rate. By week three, barely anyone from that same campaign is converting. Acceptance stays consistent — replies drop off.
Why it happens: Most replies happen at step one or two of a sequence. If there's nothing after that, accepted connections who didn't reply immediately have no second touchpoint. The window closes. They move on.
What to fix: Check your sequence depth. Fewer than three steps after acceptance is likely the gap. The follow-up can't be a bump — "just circling back" gets ignored. It needs a new angle, different pain points to reference, something that makes it worth opening.
One important caveat: HeyReach doesn't show time-series RTA natively. You'll need to export your data and compare reply volume week over week manually. It's a bit of work — but it's a real signal when Pattern 1 is already ruled out.
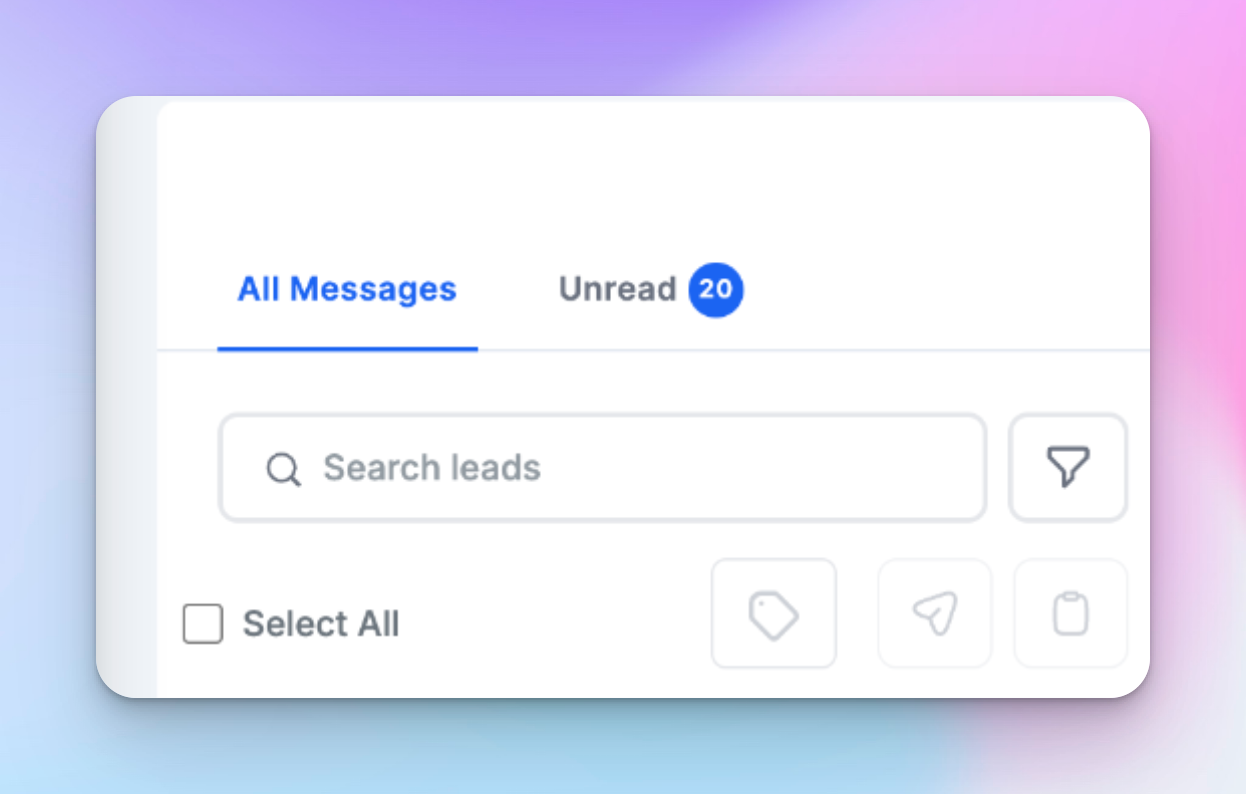
Use Unibox to identify in real-time the conversations where leads haven't replied yet, then build workflows to route those contacts into a fresh follow-up sequence with a new Step 1 opener.
Weak follow-up:
“Just following up on this — would love your thoughts.”
Stronger follow-up (new angle):
“Most GTM operators I speak to see reply drop-offs after week one — curious if that’s happening on your side too?”
Pattern 3: RTA varies significantly across campaigns
Your message was written for one audience and is running against another.
What it looks like: Campaign A sits at 25% RTA. Campaign B is at 4%. Same product. Same sender. Completely different customer segments.
Why it happens: The opener was built around a specific ICP’s pain. It converts well when the audience matches. Against a different segment — different role, different company stage, different problem set — the relevance signal breaks entirely.
The message that lands for a Head of Sales doesn't land for a RevOps lead, even if the product solves both problems. Each role is a different ideal customer with a different problem set — treating them as interchangeable is what kills RTA.
What to fix: Export your campaign data from HeyReach, sort by RTA, then compare audience filters — role, company size, seniority — across your top and bottom performers. The gap between those segments tells you exactly how your opener needs to change.
You’re looking for clear contrast between segments. For example:
If your top and bottom campaigns don’t look this different, you’re not comparing the right segments yet.
Keep the structure of Campaign A’s opener, but rewrite the problem to match RevOps priorities instead of Sales.
The diagnostic table: if X, do Y
What to fix first (priority order)
Fix in sequence. Otherwise you break your own test.
- Acceptance rate is low → fix targeting first. RTA doesn't help here — you're measuring the wrong stage. Get acceptance above ~25% before looking at anything else.
- Acceptance is fine, RTA is low and flat → fix the opening message. Pattern 1. Highest-probability cause.
- RTA varies significantly across campaigns → fix ICP-message fit. Pattern 3. Your export tells you exactly which campaign to rewrite.
- RTA drops over campaign duration → check sequence depth. Pattern 2. Fix this last — only after the opener is validated.
Three mistakes that kill the signal regardless of which pattern you're in:
- Using response rate as a diagnostic instead of an outcome metric
- Changing targeting, copy, and sequence simultaneously
- Reading results before you have 50 accepted connections per variation
How to use RTA to run cleaner outreach tests
Testing response rate across different LinkedIn campaigns produces noise. Too many variables — different audiences, different senders, different timing, different messages. You can't isolate anything.
Testing RTA within the same campaign, against the same audience, with one message variation — that's a clean test.
Use Add Message Variation in Campaign Builder to split test your Step 1 within the same campaign. Both variations reach the same audience pool.
RTA tells you which opener converted accepted connections into replies. HeyReach Positive-reply detection helps separate actual buying intent from generic responses or polite objections — without any of the confounding variables.
One rule: don't read results until each variation has at least 50 accepted connections. Under that threshold, you're reading randomness.
When RTA isn't enough (and what to check instead)
RTA only diagnoses post-acceptance performance. If acceptance itself is low, RTA won't help — you're looking at the wrong stage.
The goal of the connection stage is getting qualified leads to accept — once they do, RTA takes over.
If your acceptance rate is below ~25–30%, the problem is upstream: targeting, ideal customer profile fit, sender warm up, or how you're framing the connection request itself. No amount of RTA analysis fixes that. Sort acceptance first, then come back to RTA once the top of the funnel is clean.
The other edge case: if a campaign has fewer than 50 accepted connections, the sample is too small to read anything meaningful. Let it run longer before drawing conclusions.
What's a good RTA benchmark?
Based on 96,051 campaigns in the HeyReach dataset:
- Around 18% → typical performance
- Below ~10% → weak territory (something is broken)
- Above ~28% → strong messaging-to-ICP fit
If your RTA is around 18%, you're in the middle of the pack. That's normal — but it also means there's clear room to improve.
Below 10% is a warning sign. At that point, Pattern 1 or Pattern 3 is almost always the cause.
Above 28% is where things start working consistently. The gap between median and top performance isn't about sending more. The sales professionals above 28% are sending to the right people with a message that's actually written for them.
That’s your pattern — now fix it
Here are three takeaways before you go back to your campaigns:
1. Reply rate can't show you which pattern is broken — it's too blended, too far upstream from where the actual failure happens.
2. RTA isolates the layer that matters — what happens after the connection is accepted, when targeting has already done its job.
3. The fixes live directly in Campaign Builder. Pull your RTA per campaign, find your pattern, and fix that one thing first — that's how LinkedIn outreach gets better with each cycle instead of resetting.
Unfocused outreach efforts are noise until you know which layer is broken.
Try it for free
Frequently Asked Questions
What is reply-to-acceptance rate (RTA) and how is it different from reply rate?
Reply-to-acceptance rate (RTA) measures replies divided by accepted connections — not total messages sent. Reply rate divides replies by everyone you messaged, including people who never accepted. That makes it a blended number. RTA isolates only the people who said yes to connecting. If your RTA is low, targeting isn't the issue — they already accepted. The breakdown is happening inside your LinkedIn messages or sequence. For lead generation teams running LinkedIn at volume, this distinction is the difference between a campaign that improves and one that just resets.
Why do people accept my LinkedIn connection but not reply?
People accept LinkedIn connections because it’s low effort — but they only reply if the message feels relevant. Like most of LinkedIn's users, they accept because it's one click, zero commitment. What they’re actually deciding is whether your first message is worth their time — and most aren’t. Either the opener reads like a pitch they’ve seen a hundred times, or it was written for a completely different ICP than the person receiving it. Acceptance gets you in the door. Your initial outreach message decides whether the door stays open. It's the same reason cold email open rates don't tell you why someone didn't reply — the stages are measuring different things.
What should I fix first if my LinkedIn reply rate is low?
Start by fixing acceptance rate — not reply rate. If acceptance is below ~25%, you have a targeting problem and RTA won’t help. Once acceptance is healthy, look at RTA. Low and flat across campaigns means your opener is broken — Pattern 1. RTA varies across campaigns means ICP-message mismatch — Pattern 3. Sequence depth is the last thing you touch, only after the opener is validated.
What is a good RTA benchmark for LinkedIn outreach?
A good RTA benchmark for LinkedIn outreach is around 18% (median), based on 96,051 HeyReach campaigns. Below ~10% and something is clearly broken. Above ~28% means your Step 1 messaging and ICP fit are genuinely working.
How do I A/B test LinkedIn outreach messages in HeyReach?
To A/B test LinkedIn outreach messages in HeyReach, use Add Message Variation inside Campaign Builder. Test two versions of your Step 1 message within the same campaign — same audience, same timing, one variable changed. That’s how you get a clean signal. Don’t read results until each variation has at least 50 accepted connections. Anything under that and you’re making decisions based on noise.